
Classification of Signals used in Electrical Engineering
Classifying signals is a way to organize the signals that surround us. It focuses design, testing requirements, measurement tools, and expected results. There are many ways to classify signals!
Classifying signals is a way to organize the signals around us. It focuses design, testing requirements, measurement tools, and expected results. There are many ways to classify signals!
Supporting Information
Signals Surround Us
We're surrounded by signals. Visual, audio, mechanical, electrical; active, passive; physical events which convey information, alert us to the specific conditions, and deliver our energy. With prearranged signals, we know what has happened as soon as evidence of the signal occurs. Other signals carry information within them and need to be decoded and processed in order to learn what they mean. Still, other signals carry power and the only information we get is that our building is still receiving 120V AC.
Signals get us up on time, control traffic; deliver radio, TV, and news. They let us know when our rivers are at flood stage or the force of a gale wind. Even when not activated, as long as we know what is being monitored, we are getting information. When the Check Engine icon is not activated, we know our car's system is working as expected. Other systems may provide a heartbeat signal or a continuously lit LED to show the system is functioning within specs.
Embedded within systems, electrical signals can also initiate actions to ensure our safety and comfort. We're alerted to a possible fire; fire suppressors are activated. Our air conditioner goes on automatically when the temperature rises. A leak in an underground system is detected and made known. We depend on our signals!
Electrical Engineers (EEs) and Signals
An Electrical Engineer's world is one of signals. EEs describe signals as electrical or electromechanical encoded data. Even within this narrow definition there are so many types of signals that classifying them by physical characteristics or other methods helps organize the type of equipment needed, the test procedures and measurement equipment required, as well as address any safety concerns or regulations. Classifying signals helps in analyzing, processing, and validating circuits. Signals can be classified by any of their physical properties, their intended use; and their visual and mathematical properties. The same signal may be classified in more than one way depending on what the system is doing and how the signals are used. The specific field of engineering may emphasize one way to classify one signal versus another. And each field may classify signals differently, adding more detail as they continue their research, like in acoustics, power, or electroencephalographic signals (EEG) signals. Broadcast engineers might work in cabled systems (digitized, compressed, encrypted signals) or over-the-air signals (analog, RF). Within software operating systems, signals can indicate errors, normal interrupts, illegal events, and take direct actions.
Circuit designers and systems engineers work on a variety of systems. The way they classify signals may refer to individual signals or the entire system which handles that type of signal. Many times a mathematical representation of a signal is possible and helps in the analysis. Let's look at some ways signals might be classified.
Electrical Systems
Thanks to Thomas Edison and Nikola Tesla, there are two electrical systems in use today; equipment, components, and delivery options differ for each. Alternating current (AC) and direct current (DC) each have their use and we need both. The difference in primary power is a basic way to distinguish signals. Figure 1 shows an AC and DC circuit.
Alternating current (AC), available from the familiar power receptacle is a sinusoidal time-varying signal. It's generated by generators and available from power plants delivered to buildings and individual residences as three-phase sinusoidal signal which is stepped down to 120V AC at 60 Hz in North America; 50 Hz is used in Europe. Signals delivering power differ in magnitudes from those used in sourcing circuits that EEs generally use in their circuits.
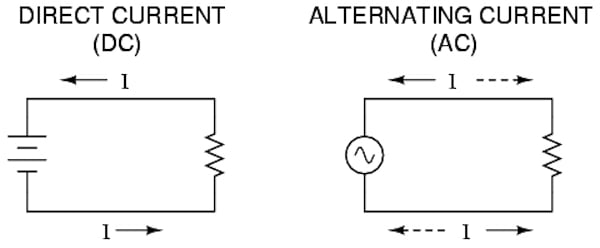
Figure 1. AC and DC Circuits
Textbooks are full of problems giving the source as:
E(t) = k sin(ωt) where k is the amplitude and ω = 2πf
This is a subset of the more general equation:
S(t) = A sin(2πft ± θ) where A is the maximum amplitude
f is the frequency (1/T (period)
t is the instantaneous time
θ is the phase
Direct current (DC) is available from batteries in standard voltages (1.5V DC, 9V DC), generators, or power supplies designed to deliver the specific voltage needed for the circuit or appliance. (24V DC, 48V DC, 120V DC). Except for transient effects, the voltage delivered is constant.
Frequency
Classifying signals by frequency identifies the spectrum and propagation methods. Visual, audio, RF, microwave; wired, fiber optics, air/vacuum/space. AC signals identify frequency. In DC systems with system clocks driving circuitry, terms used may be the clock speed, processor machine instructions per second (MIPS), and pulses per second (PPS).
Voltages
Both AC and DC electrical power systems are classified as low or high voltage. The IEEE defines standards for AC and DC with papers, conferences, labs, and research devoted to each. Definitions are generally given as:
Low VoltageAC :1000 V and below; DC: 3200 V and below
High Voltage: AC: above 1000 V
Ultra High Voltage: 1000kV or Greater AC Systems
In digital systems, where logic families dictate voltage requirements, much lower signal levels are used. Transistor logic usually requires 5VDC, while CMOS and low power systems may use higher and lower voltages.
Analog/Digital
Signals within electrical circuits can be classified by the continuity of amplitude values - analog or digital. Analog AC signals like the sine and cosine waveforms have constantly changing values which range from the minimum to the maximum of the signal's amplitude range. There is an amplitude value for each point of time that is proportional to a previous and future value for the waveform.
Digital signals have specific values for amplitude. Digital binary systems have only 2 values, typically operating between 0 and 5V DC; (though in practical circuits a range is accepted). This is a result of the characteristics of the transistor. Either On or Off, conducting or not, two values are presented at the output port.
Continuous/Discrete
The signals may also be classified by time continuity: a continuous signal has values for all values of time without breaks or areas where the signal doesn't exist. Sine and cosine waveforms are continuous, where the tangent waveform has discontinuities where values don't exist.
Discrete signals have values at only specific times. A sampling circuit yields signal values only for times the sampling takes place.
Figures 2 and 3 show discrete and continuous signals.
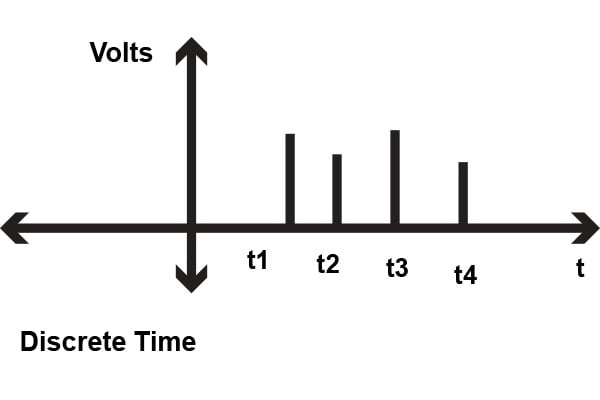
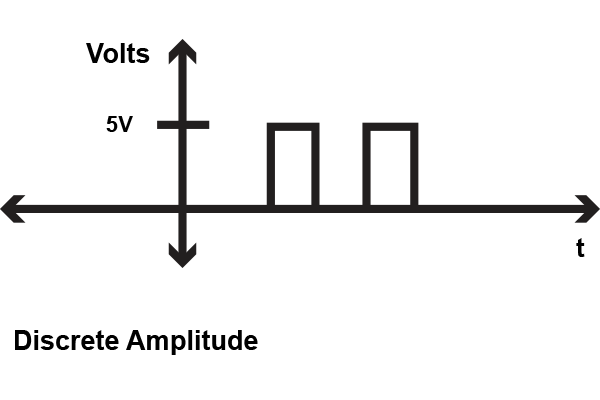
Figure 2. Discrete Signals: Time and Amplitude
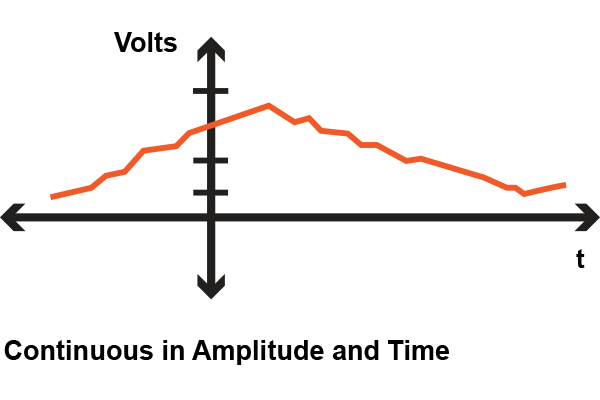
Figure 3. Continuous signal for both time and amplitude values
Waveform characteristics - Periodic/Aperiodic
Signals may be classified according to the visual nature of the waveform. Periodic signals repeat within a given time period. Mathematically represented by the equation:
s(t) = s(t + T) where T is the period (1/frequency).
Periodic signals exist in both AC (analog) and DC (digital) systems, like the sine wave or digital system clock signal. Figure 4 shows some periodic signals. Aperiodic signals do not repeat. Some mathematical tools are only available for periodic signals. The Fourier series was developed for use for periodic signals. To be used on aperiodic signals, the signal was treated as a periodic signal with an infinite period. This allowed Fourier transforms to be used for all signals.
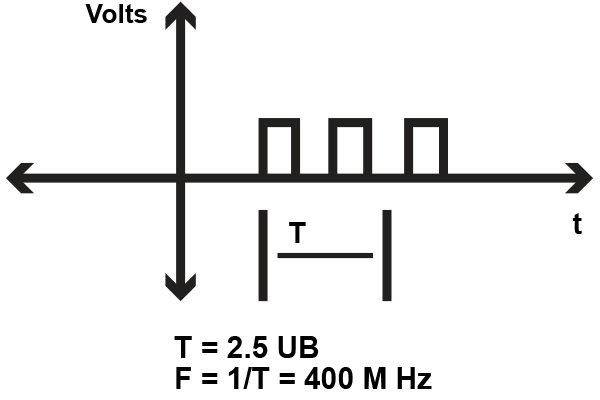

Figure 4. Digital and Analog Periodic Signals
Waveform Characteristics - Even/Odd
Even signals are symmetrical about the y-axis. Mathematically, f(x) = f(-x). A point(X,Y) would have the same value of a point at (-X,Y). The Fourier series decomposes a signal into a sum of sines and cosines:
FS = A0 + ∑ An sin(n) + ∑ Bn cosine(n);
Where A0 is the DC component and each term has an associated amplitude and trigonometric component (sine and cosine).
Even signals result when only cosine components compose the signal. The cosine itself is an even signal and symmetric about the y-axis. Figure 5 shows an even signal and the cosine waveform.
Odd signals are symmetrical about the origin. Mathematically, f(t) = -(f(-t)). Fourier series of odd signals only have sine components. The sine itself is an odd signal and symmetric about the origin, as shown in Figure 6. A signal can be decomposed into even and odd signals.
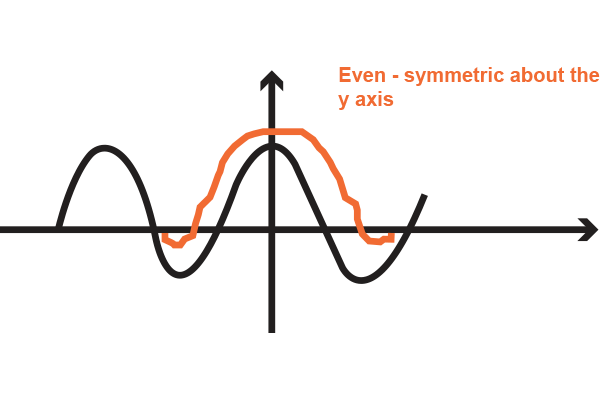
Figure 5. Even Signals; symmetrical about the y-axis
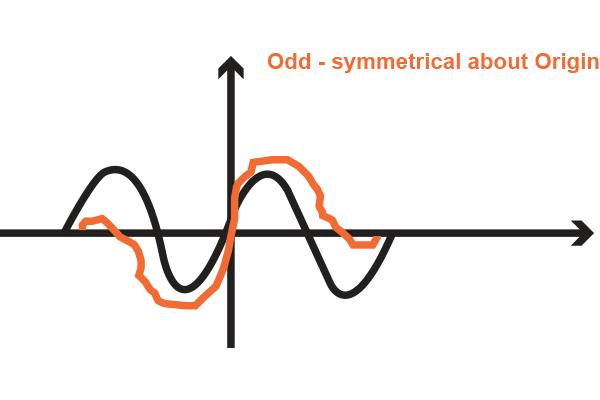
Figure 6. Odd Signals; symmetrical about the Origin
Deterministic/Random
If you're familiar with modeling and analysis programs, you've worked with signals that are classified as deterministic or random. Deterministic signals can be predicted by past behavior and totally captured by mathematical equations. All possible outcomes are known and there are no risk factors. Deterministic signals are useful in communications where knowing the exact values of a carrier signal is important for modulation techniques.
Random signals are not predictable and are represented by probabilistic functions, familiar from probability theory, like the Poisson function. Circuit noise is usually modeled as, and is, a random signal.
Somewhat similar are causal signals. Though it's tempting to look at causal waveform graphs and think they have to do with timing, the causality is a result of how the system was modeled. Causal signals are only determined from past or present conditions as inputs. When the system starts at t=0, the following data are computed from the initial conditions and then generated from previous results. The system can continue to infinity. Control systems illustrate this behavior.
Anti-causal systems generate results from future events as well and stop at t=0. Not represented in real life, anti-causal signals allow scenarios where possible future events can be analyzed. Non-causal signal waveforms have value and results for any time t < 0 and t > 0.
Encoding
Sensor signal output can be classified by the type of data encoding used. Sensors usually measure physical quantities; analog data like temperature, pressure, etc. Depending on the sensor, the analog-to-digital conversion can be handled within the unit and results are provided in digital form: binary, octal, hexadecimal, binary-coded-decimal (BCD), and gray code output.
Synchronous/Asynchronous
Digital systems have signals that are divided into control or data signals. Control signals may be classified as synchronous or asynchronous. Repetitive periodic clock signals drive the timing for the logic and processing functions. When the logic levels all change state based on the timing of the clock, the signals are synchronous, synced to the clock. Logic levels at the inputs of components only take effect with the timing of the clock signal.
Asynchronous signals have output logic states changing anytime, regardless of the clock cycle. Reset signals can be received anytime and cause output levels to go to predetermined states regardless of the clock timing. Asynchronous signals can also provide handshaking and other protocols to accommodate slower or external peripherals.
Summary
Signals are in involved in all aspects of electrical engineering. Classifying signals act as a shorthand in designing, discussing, conveying results, and analysis. There are many ways to classify a signal, depending on the area of interest, field of study, and mathematical representations.The more familiar you get with the signals you use, the more ways you'll find to classify them!
FS = A0 + ∑ An sin(n) + ∑ Bn cosine(n)


Very informative! Thanks!