Computerized Fourier analysis, particularly in the form of the FFT algorithm, is a powerful tool for furthering our understanding of waveforms and their related spectral components.
This same mathematical routine programmed into the SPICE simulator as the .fourier option is also programmed into a variety of electronic test instruments to perform real-time Fourier analysis on measured signals.
This section is devoted to the use of such tools and the analysis of several different waveforms.
First we have a simple sine wave at a frequency of 523.25 Hz. This particular frequency value is a “C” pitch on a piano keyboard, one octave above “middle C”.
Actually, the signal measured for this demonstration was created by an electronic keyboard set to produce the tone of a pan flute, the closest instrument “voice” I could find resembling a perfect sine wave. The plot below was taken from an oscilloscope display, showing signal amplitude (voltage) over time:

Oscilloscope display: voltage vs time
Viewed with an oscilloscope, a sine wave looks like a wavy curve traced horizontally on the screen. The horizontal axis of this oscilloscope display is marked with the word “Time” and an arrow pointing in the direction of time’s progression. The curve itself, of course, represents the cyclic increase and decrease of voltage over time.
Close observation reveals imperfections in the sine-wave shape. This, unfortunately, is a result of the specific equipment used to analyze the waveform. Characteristics like these due to quirks of the test equipment are technically known as artifacts: phenomena existing solely because of a peculiarity in the equipment used to perform the experiment.
If we view this same AC voltage on a spectrum analyzer, the result is quite different:
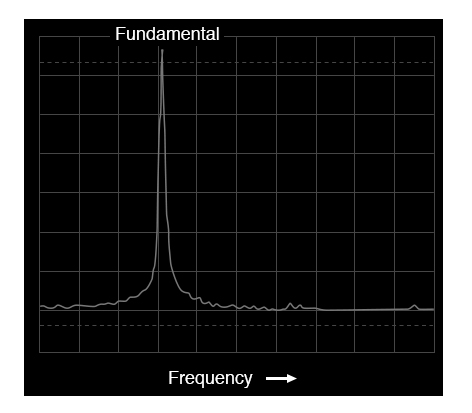
Spectrum analyzer display: voltage vs frequency
As you can see, the horizontal axis of the display is marked with the word “Frequency,” denoting the domain of this measurement. The single peak on the curve represents the predominance of a single frequency within the range of frequencies covered by the width of the display.
If the scale of this analyzer instrument were marked with numbers, you would see that this peak occurs at 523.25 Hz. The height of the peak represents the signal amplitude (voltage).
If we mix three different sine-wave tones together on the electronic keyboard (C-E-G, a C-major chord) and measure the result, both the oscilloscope display and the spectrum analyzer display reflect this increased complexity:
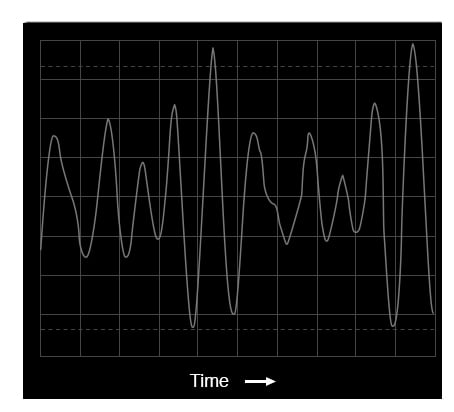
Oscilloscape display: three tones
The oscilloscope display (time-domain) shows a waveform with many more peaks and valleys than before, a direct result of the mixing of these three frequencies. As you will notice, some of these peaks are higher than the peaks of the original single-pitch waveform, while others are lower.
This is a result of the three different waveforms alternately reinforcing and canceling each other as their respective phase shifts change in time.
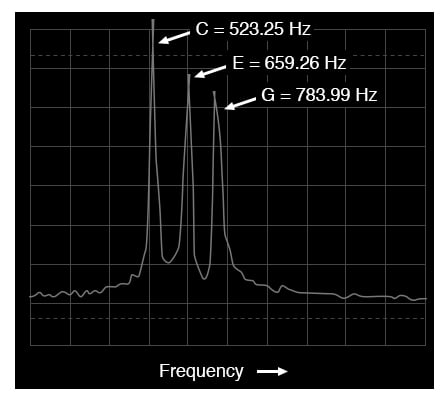
Spectrum analyzer display: three tones
The spectrum display (frequency-domain) is much easier to interpret: each pitch is represented by its own peak on the curve. The difference in height between these three peaks is another artifact of the test equipment: a consequence of limitations within the equipment used to generate and analyze these waveforms, and not a necessary characteristic of the musical chord itself.
As was stated before, the device used to generate these waveforms is an electronic keyboard: a musical instrument designed to mimic the tones of many different instruments.
The panflute “voice” was chosen for the first demonstrations because it most closely resembled a pure sine wave (a single frequency on the spectrum analyzer display). Other musical instrument “voices” are not as simple as this one, though. In fact, the unique tone produced by any instrument is a function of its waveshape (or spectrum of frequencies).
For example, let’s view the signal for a trumpet tone:
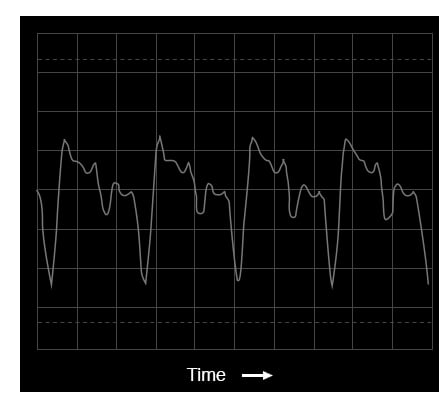
Oscilloscope display: waveshape of a trumpet tone
The fundamental frequency of this tone is the same as in the first panflute example: 523.25 Hz, one octave above “middle C.”
The waveform itself is far from a pure and simple sine-wave form. Knowing that any repeating, non-sinusoidal waveform is equivalent to a series of sinusoidal waveforms at different amplitudes and frequencies, we should expect to see multiple peaks on the spectrum analyzer display:
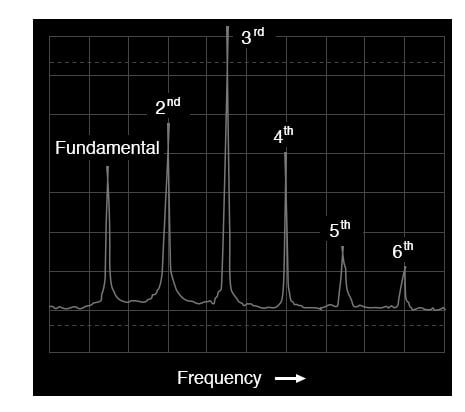
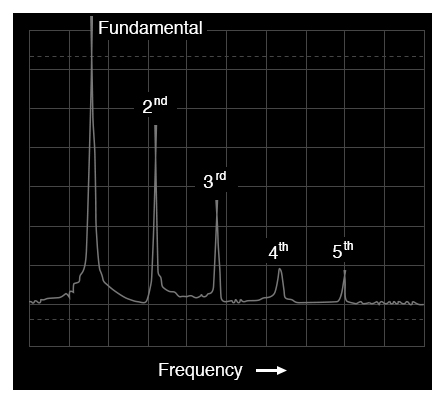
Spectrum of a trumpet tone
Indeed we do! The fundamental frequency component of 523.25 Hz is represented by the left-most peak, with each successive harmonic represented as its own peak along the width of the analyzer screen.
The second harmonic is twice the frequency of the fundamental (1046.5 Hz), the third harmonic three times the fundamental (1569.75 Hz), and so on. This display only shows the first six harmonics, but there are many more comprising this complex tone.
Trying a different instrument voice (the accordion) on the keyboard, we obtain a similarly complex oscilloscope (time-domain) plot and spectrum analyzer (frequency-domain) display:
Oscilloscope display: waveshape of accordion tone
Spectrum of accordion tone
Note the differences in relative harmonic amplitudes (peak heights) on the spectrum displays for trumpet and accordion. Both instrument tones contain harmonics all the way from 1st (fundamental) to 6th (and beyond!), but the proportions aren’t the same.
Each instrument has a unique harmonic “signature” to its tone. Bear in mind that all this complexity is in reference to a single note played with these two instrument “voices.” Multiple notes played on an accordion, for example, would create a much more complex mixture of frequencies than what is seen here.
The analytical power of the oscilloscope and spectrum analyzer permit us to derive general rules about waveforms and their harmonic spectra from real waveform examples. We already know that any deviation from a pure sine-wave results in the equivalent of a mixture of multiple sine-wave waveforms at different amplitudes and frequencies.
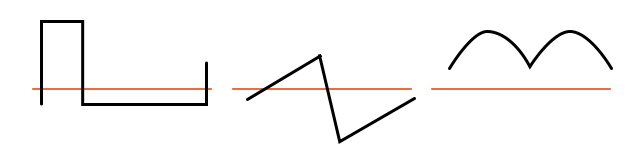
However, close observation allows us to be more specific than this. Note, for example, the time and frequency-domain plots for a waveform approximating a square wave:
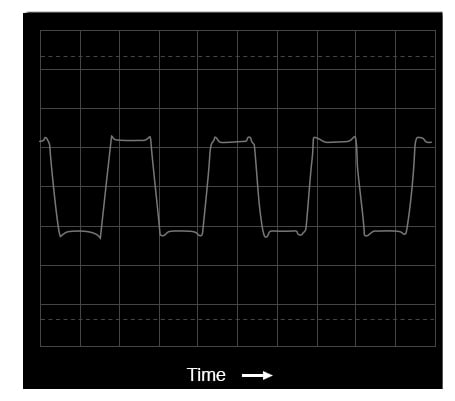
Oscilloscope time-domain display of a square wave
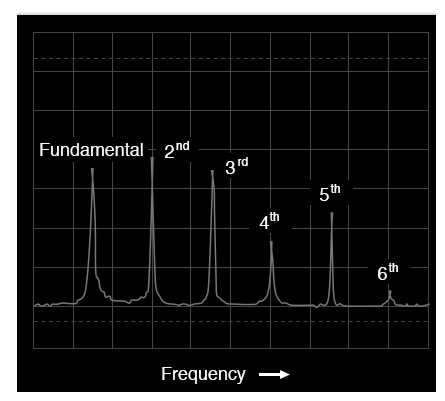
Spectrum (frequency-domain) of a square wave
According to the spectrum analysis, this waveform contains no even harmonics, only odd. Although this display doesn’t show frequencies past the sixth harmonic, the pattern of odd-only harmonics in descending amplitude continues indefinitely.
This should come as no surprise, as we’ve already seen with SPICE that a square wave is comprised of an infinitude of odd harmonics. The trumpet and accordion tones, however, contained both even and odd harmonics.
This difference in harmonic content is noteworthy. Let’s continue our investigation with an analysis of a triangle wave:
Oscilloscope time-domain display of a triangle wave
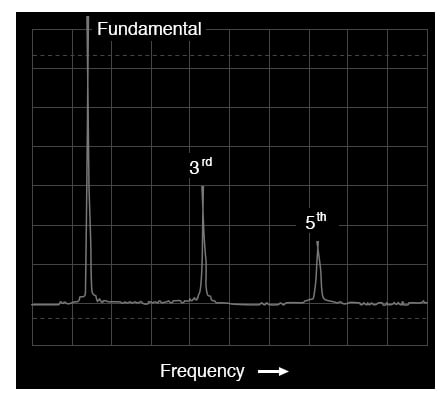
Spectrum of a triangle wave
In this waveform there are practically no even harmonics: (Figure above) the only significant frequency peaks on the spectrum analyzer display belong to odd-numbered multiples of the fundamental frequency.
Tiny peaks can be seen for the second, fourth, and sixth harmonics, but this is due to imperfections in this particular triangle waveshape (once again, artifacts of the test equipment used in this analysis).
A perfect triangle waveshape produces no even harmonics, just like a perfect square wave. It should be obvious from inspection that the harmonic spectrum of the triangle wave is not identical to the spectrum of the square wave: the respective harmonic peaks are of different heights. However, the two different waveforms are common in their lack of even harmonics.
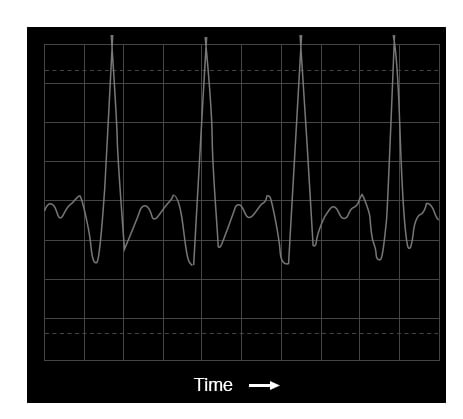
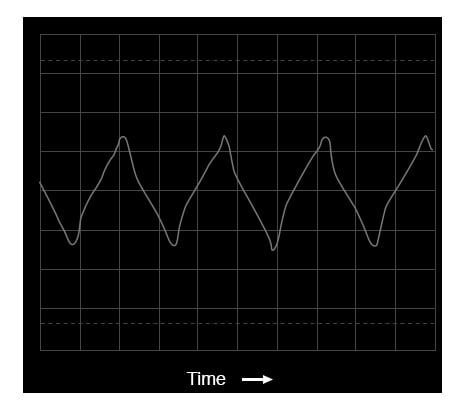
Let’s examine another waveform, this one very similar to the triangle wave, except that its rise-time is not the same as its fall-time. Known as a sawtooth wave, its oscilloscope plot reveals it to be aptly named:
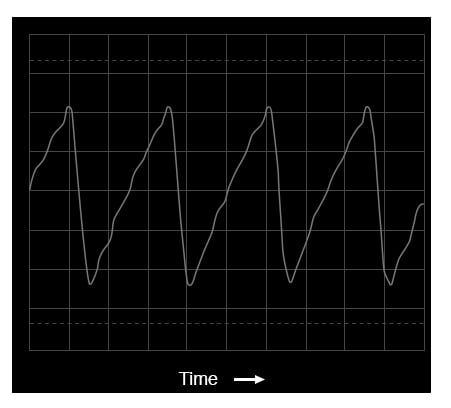
Time-domain display of a sawtooth wave
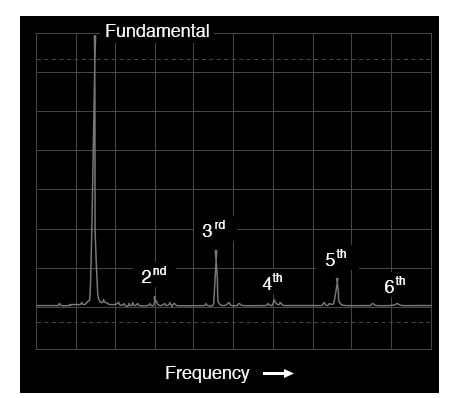
When the spectrum analysis of this waveform is plotted, we see a result that is quite different from that of the regular triangle wave, for this analysis shows the strong presence of even-numbered harmonics (second and fourth):
Frequency-domain display of a sawtooth wave
The distinction between a waveform having even harmonics versus no even harmonics resides in the difference between a triangle waveshape and a sawtooth waveshape.
That difference is symmetry above and below the horizontal centerline of the wave. A waveform that is symmetrical above and below its centerline (the shape on both sides mirror each other precisely) will contain no even-numbered harmonics.
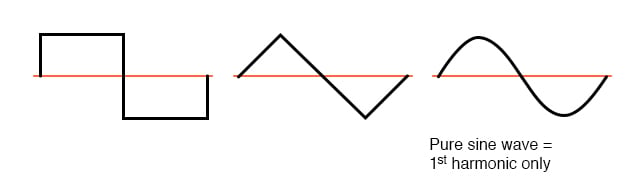
Waveforms symmetric about their x-axis center line contain only odd harmonics
Square waves, triangle waves, and pure sine waves all exhibit this symmetry, and all are devoid of even harmonics. Waveforms like the trumpet tone, the accordion tone, and the sawtooth wave are unsymmetrical around their centerlines and therefore do contain even harmonics.
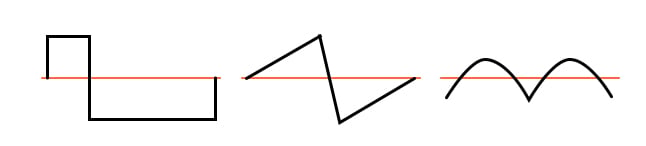
Asymmetric waveforms contain even harmonics
This principle of centerline symmetry should not be confused with symmetry around the zero line. In the examples shown, the horizontal centerline of the waveform happens to be zero volts on the time-domain graph, but this has nothing to do with harmonic content.
This rule of harmonic content (even harmonics only with unsymmetrical waveforms) applies whether or not the waveform is shifted above or below zero volts with a “DC component.” For further clarification, I will show the same sets of waveforms, shifted with DC voltage, and note that their harmonic contents are unchanged.
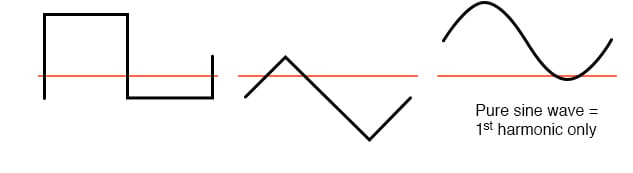
These waveforms are composed exclusively of odd harmonics
Again, the amount of DC voltage present in a waveform has nothing to do with that waveform’s harmonic frequency content.
These waveforms contain even harmonics
Why is this harmonic rule-of-thumb an important rule to know? It can help us comprehend the relationship between harmonics in AC circuits and specific circuit components.
Since most sources of sine-wave distortion in AC power circuits tend to be symmetrical, even-numbered harmonics are rarely seen in those applications.
This is good to know if you’re a power system designer and are planning ahead for harmonic reduction: you only have to concern yourself with mitigating the odd harmonic frequencies, even harmonics being practically nonexistent.
Also, if you happen to measure even harmonics in an AC circuit with a spectrum analyzer or frequency meter, you know that something in that circuit must be unsymmetrically distorting the sine-wave voltage or current, and that clue may be helpful in locating the source of a problem (look for components or conditions more likely to distort one half-cycle of the AC waveform more than the other).
Now that we have this rule to guide our interpretation of nonsinusoidal waveforms, it makes more sense that a waveform like that produced by a rectifier circuit should contain such strong even harmonics, there being no symmetry at all above and below center.
REVIEW:
RELATED WORKSHEETS:
In Partnership with Ymin

by Murata

by Jake Hertz
by Aaron Carman

