
 Facebook
 Google
 GitHub
 Linkedin
Mathematics for Electronics
Basic Algebra and Graphing for Electric Circuits
16 questions By Tony R. Kuphaldt
-
Question 13 of 16
A function is a mathematical relationship with an input (usually x) and an output (usually y). Here is an example of a simple function:
y = 2x +1 One way to show the pattern of any given function is with a table of numbers. Complete this table for the given values of x:
x 2x 1
0
1
2
3
4
5
A more common (and intuitive) way to show the pattern of any given function is with a graph. Complete this graph for the same function y = 2x 1. Consider each division on the axes to be 1 unit: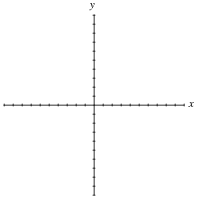
Reveal answer
x 2x 1
0 1
1 3
2 5
3 7
4 9
5 11
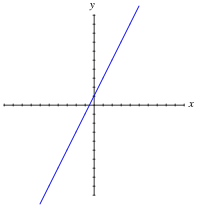
Notes:It is very important for your students to understand graphs, as they are very frequently used to illustrate the behavior of circuits and mathematical functions alike. Discuss with them how the line represents a continuous string of points and not just the integer values calculated in the table.
-
Question 14 of 16
A famous illustrative story for understanding exponents goes something like this:
- A pauper saves the life of a king. In return, the king offers the pauper anything he desires as a reward. The pauper, being a shrewd man, tells the king he does not want much, only a grain of rice today, then double that (two grains of rice) the next day, then double that (four grains of rice) the next day, and so on. The king asks how long he is to give the pauper rice, and the pauper responds by saying one day for every square on a chess board (64 days). This does not sound like much to the king, who never took a math course, and so he agrees.
In just a short amount of time, though, the king finds himself bankrupted to the pauper because the quantity of rice is so enormously large. Such is the nature of exponential functions: they grow incredibly large with modest gains in x.
Graph the pauper’s rice function (y = 2x), with each division on the horizontal axis representing 1 unit and each division on the vertical axis representing 100 units.

Reveal answer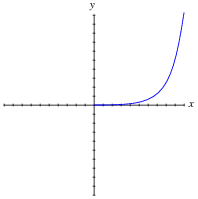
Follow-up question: what do you think this graph will look like for negative values of x?
Notes:From the graph shown, it may appear that the function approaches 0 as x approaches zero. This is not the case, as a simple calculation (y = 20) shows. In order for students to adequately see what is going on near the origin, they will have to re-scale the graph.
-
Question 15 of 16
Match each written function (y = …) with the sketched graph it fits best:
y = 3x + 2 y = 5 − 2x y = x2 y = 2x 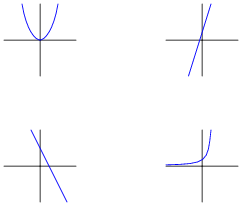
Reveal answer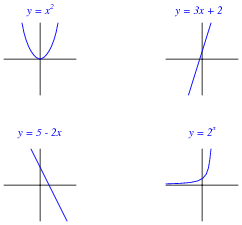
Notes:The primary purpose of this question is to have students figure out how to match each expression to a graph. Of course, one could take the time to plot each function one by one, but there exist much simpler ways to determine the “character” of a function without plotting the whole thing.
Related Tools:
- Performance-Based Assessments for DC Circuit Competencies
- Conventional Transistor Overview and Special Transistors





Question 3, answer - the ‘+’ symbol is missing from ‘= a^(m+n)’.
Question 7, question and answer - second equation should have a multiplication symbol, not the ‘variable x’.
Question 8, question and answer - second equation should have a multiplication symbol, not the ‘variable x’.
Question 9, question - the ‘+’ symbol is missing between ‘4.5154 ‘+’ 14’.
Question 9, answer:
- the ‘+’ symbol is missing: 10 − 25 ×2 ‘+’ 5 = −35
- the ‘+’ symbol is missing: −8 ‘+’ 10^3 ×51 = 50992
- the ‘+’ symbol is missing: 12^4 ×(3 ‘+’ 11) = 290304
Question 9, question and answer: The square root should enclose the whole equation, and the equation should have a multiplication symbol, not the ‘variable x’.
Question 13, question and answer: The table columns need spacing and the ‘+’ symbol is missing from the headings ‘2x + 1’.
These are all correct in the PDF version.