Facebook
 Google
 GitHub
 Linkedin
Debugging Common I2C and SPI Problems with Advanced Oscilloscopes
There are a host of tricky challenges that emerge when debugging complicated I2C and SPI errors. Learn how leveraging key features of today’s advanced oscilloscopes can smooth the way.
Oscilloscopes are an invaluable debugging tool for testing various applications, including semiconductor testing, power supply testing, low power testing, and power rail analysis. But as the electronics and communication protocols between devices advance, debugging can quickly become more time-consuming.
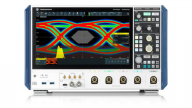
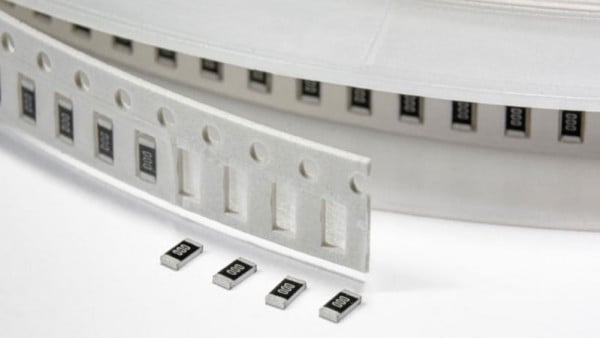
Advanced oscilloscopes, such as the one shown in Figure 1, can still support basic debugging while making it possible to take a deep dive into triggers, events, and multiple signals.

Figure 1. Advanced designs call for advanced digital oscilloscopes for debugging
Features such as multi-grade displays, event searchers, intelligent triggers, and deep data memory make it possible to quickly find and correct even the most complex I2C and SPI errors. This article reviews common signal and timing errors, the challenges involved in debugging them, and how the features of advanced oscilloscopes support more efficient resolution of these errors.
Common I2C and SPI Signal and/or Timing Errors
I2C and SPI are the most widely used protocols for communication among controllers and between controllers and peripheral chips.
I2C
I2C (Inter-Integrated Circuit) is a straightforward onboard communication protocol and a physical two-wire interface: SCL (bi-directional serial clock) and SDA (data). It supports multiple masters and slaves on the bus as long as only one master is active at a time, and any I2C device can be attached to the bus such that any master device can exchange information with any slave device. The number of devices is limited by the maximum capacitance—for instance, 400 pF can support between 20 to 30 devices).
The most common issues with I2C are:
- Slow rise times
- Crosstalk
- Low-level output voltages that are too high
- Large undershoots section
- Unintended contention.
SPI
SPI (Serial Peripheral Interface) is a full-duplex protocol. It uses a master/slave, 4-wire, or 3-wire serial communications bus with four basic signals: SCLK (clock), MOSI (master output/slave input), MISO (master input/slave output), and SS (slave select). Note that the master device always drives the clock.
Basic SPI problems usually involve:
- Timing errors related to phase and polarity
- Incorrect synchronization
- Issues with the bus.
The good news is that many I2C and SPI problems can be debugged using an oscilloscope.
It Starts Capturing the I2C and SPI Signal
Much of debugging I2C and SPI errors depends on investigating what happens when a chip sends a particular I2C/SPI packet. Here, oscilloscope waveforms and triggers—when properly used—can provide engineers with the data they need to debug. However, as effective as these approaches are, there are still some issues with capturing the necessary data effectively and efficiently.
Waveform analysis on an oscilloscope is invaluable for debugging many problems. For example, slow rise times in I2C can prevent a signal from reaching the VIG (high-level input voltage) in time for expected functionality. In addition, they can be related to the value of the pull-up resistance and whether the maximum allowed rise time complies with the I2C standard. Issues with rise times can be investigated by comparing the SDA and SDC signal waveforms together.

Figure 2. I2C clock and data with noise from poor grounding
Studying the waveforms of the SDA and SDC signals can also reveal the presence of crosstalk and assist an engineer in determining if the crosstalk has a significant impact on I2C signals. As alluded to earlier, low-level output voltages are also a common source of problems with I2C. Comparing VOL and VIL for SDA and SDC signals can reveal the presence of an issue.
However, as it becomes necessary to investigate more and more waveforms simultaneously, the screen can quickly become cluttered. While it is, of course, still possible to debug, it may take longer. And even more helpful is the ability to display specific signals based on how often they appear. This enables faster detection of anomalies, which can be especially useful for uncommon errors.
Another challenge with many oscilloscopes is maintaining a high sample rate (often needed when longer division or time settings become necessary) without running out of data memory.
Waveform Analysis and Triggers
Another important aspect of waveform analysis involves triggers. For example, one of the common issues with SPI is incorrect synchronization. The main CPU initializes a slave device by writing 24-bit words. At first glance of the waveform, the signals may appear to comply with the SPI standard. Using an SS active trigger (a trigger for when slave select goes active), the entire initialization sequence can be captured. The information it supplies can be used to determine where the synchronization issue lies.

Figure 3. DAC output and 8 bit input bus triggered by a digital pattern
Many triggers may be used during debugging, such as edge, smart, software, runt, setup-and-hold, and pulse-width. Not all forms of triggering are simple, and not all oscilloscopes provide the range of options needed to use them successfully.
When debugging more complex issues, data about rare or critical events is obtained by triggering that may take place over an extended time. And that data may include details that are not important to the debugging processes, potentially adding additional time to the debugging process as an engineer sifts through this data to find the most important details. More advanced types of triggering, including intelligent triggering, are also key when the problems are not among the most common issues for a communication protocol.
Features for Easier Capture and Debug
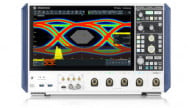
There are newer, advanced oscilloscopes that make waveform analysis and problem-solving much easier by addressing the debugging challenges just discussed. For example, a 10.1” high-resolution color-graded touch display (Figure 4) only allows multiple waveforms overlaid on each other.
Importantly, different visualization techniques can be chosen to allow infrequent anomalies to be displayed with varying pixel intensity—there are 256 grading steps. UltraAcquire mode adds new visualization modes, including mosaic, waterfall, and perspective views of overlapping signals. Features like this help minimize clutter on the oscilloscope screen, make the data more informative, and support much more advanced debugging for both I2C and SPI applications.

Figure 4. Multi-pane high-definition touch display combined with new visualization techniques makes signals easier to interpret, analyze, and debug.
Another aspect of advanced oscilloscope technology is deep data memory. Maintaining a high sample rate, especially when longer time/division settings are used, can be extremely difficult without sufficient data memory. Insufficient memory makes it difficult to acquire signals over long periods without losing critical signal details. Again, this supports both basic and advanced debugging techniques.
The ability to search and mark events using parameters is necessary for more advanced debugging. When combined with high-resolution visualization modes, the debug and mode data contain more helpful information. Figure 5 shows an example of what the search results would look like when set to identify rising edges. And intelligent triggering ensures that the rare, important events of interest are stored without including irrelevant data, resulting in more concise, usable information.

Figure 5. Example of a data table showing the results from searching and marking features
These features make capturing data and debugging much easier, reducing the time needed for testing and the time to market for new products. For example, consider the example of continuous capture over an extensive time combined with event marking and event searching shown in Figure 6.

Figure 6. Combining key features of advanced oscilloscopes can make debugging data not only easier to obtain but also easier to investigate and interpret.
Oscilloscope Addresses I2C and SPI Issues
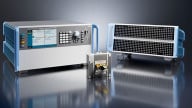
The DHO1000 and DHO4000 Series are the newest additions to the RIGOL UltraVision III line of oscilloscopes, including all the features discussed to help engineers debug complex I2C and SPI issues. Their capabilities begin with true 12-bit ADCs and bandwidths up to 800 MHz. They also have high-resolution color-graded touch displays to support more efficient waveform analysis and reduce the complexity of comparing multiple waveforms.
To further make visualization easier and more powerful for engineers, this RIGOL oscilloscope offers an UltraAcquire burst capture, and visualization mode offers a bandwidth of up to 5 GHz with a maximum sampling rate of 20 Gsamples/sec. This allows users to capture small, dynamic changes within a complex signal.
Deep data memory is key to achieving a high sampling rate, and the RIGOL Ultravision supports a memory depth of up to 500 Mpts supporting a 4 Gsamples/s sampling rate on the DHO4000 Series. This also makes it possible to obtain highly precise measurements for complete signal analysis. These features allow users to record, navigate, and analyze extensive data with flexible memory.
These oscilloscopes have extensive search capabilities, including searching and marking events using Edge and Pulse parameters. They also include intelligent triggering and detailed waveform visualization modes to speed debug and improve analysis. For example, the RIGOL Ultravision III series has a high-resolution waveform capture rate of 8-bit ADCs with up to 16 bits in high-resolution mode.

Figure 7. The RIGOL Ultravision III DHO4804 is one of the advanced oscilloscopes packed with features to meet some of the most difficult debugging needs.
Features that Meet Debug Needs
It can be challenging to find an advanced oscilloscope that meets the needs of debugging communication protocols in modern systems, but the RIGOL UltraVision III oscilloscopes provide the key features engineers need to take a deep dive into the operation and performance of their designs.
All images used courtesy of RIGOL Technologies
Related Content