Facebook
 Google
 GitHub
 Linkedin
Pre-Emphasis and De-Emphasis Filtering in FM Systems
Simple first-order pre-emphasis and de-emphasis filters can boost FM receiver SNR by more than 13 dB by exploiting the spectral differences between signal and noise.
The pre-emphasis/de-emphasis (PDE) technique is a widely used method for reducing noise in FM systems, particularly in commercial FM broadcasting. The PDE method exploits the spectral properties of the message and noise to enhance SNR in FM transmission. Pre-emphasis involves using a pre-modulation filter in the transmitter to raise the power spectral density of the message in its upper-frequency range. De-emphasis is the process of attenuating the high-frequency components at the receiver, after the discriminator.
We’ll see that simple first-order pre-emphasis and de-emphasis filters can significantly improve the noise performance of FM receivers. To better understand this technique, let’s first review how noise affects the FM scheme.
Noise in FM Systems
The simplified model of an FM demodulator is shown in Figure 1 below.

Figure 1. Simplified FM demodulation system.
The core component of the system is the discriminator, which essentially extracts the phase of the incoming FM signal and outputs its time derivative. As discussed in the previous article, the noise power spectral density at the discriminator output exhibits a quadratic relationship with frequency, a pattern that emerges from the discriminator acting as a differentiator. Figure 2 shows the typical noise power spectral density at the discriminator output.
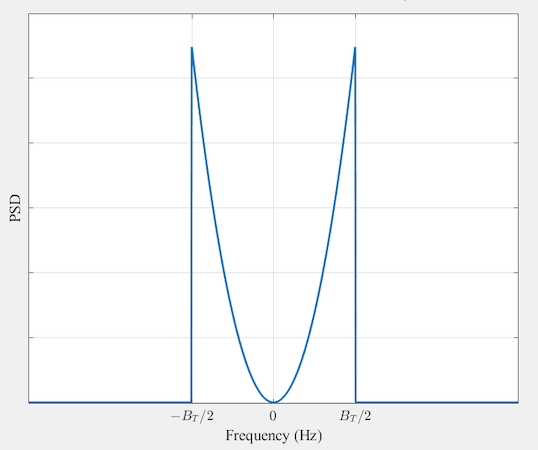
Figure 2. Power spectral density of noise at the output of the discriminator.
In the figure above, BT represents the transmission bandwidth of the incoming FM wave. Notably, the primary observation is that the noise power at the receiver output is concentrated at higher frequencies.
Message Power Spectral Density
Figure 3 shows the power spectral density of a typical audio or video signal.
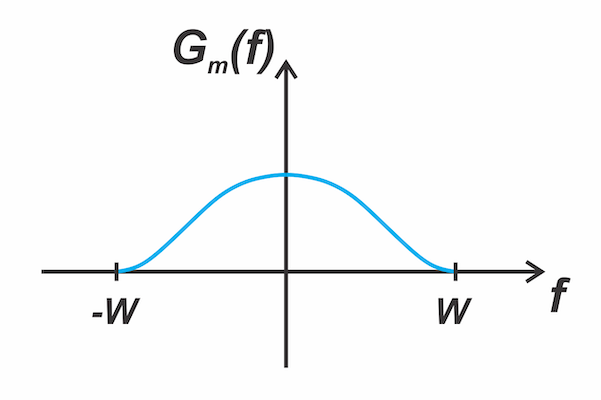
Figure 3. Power spectral density of a typical message signal.
In the above figure, W is the maximum frequency of the message signal. We observe that the message’s power spectral density is concentrated at low frequencies and drops off rapidly at higher frequencies. For example, speech exhibits minimal spectral content above 3 kHz.
Comparing Figures 2 and 3, we note that as frequency increases, the signal weakens while noise and interference grow more prominent. This communication system is inefficient because the weaker high-frequency components of the message spectrum coincide with the region where the noise spectrum is most elevated.
Pre-emphasis/De-emphasis Concept
To improve the noise performance, we can use the pre-emphasis/de-emphasis technique. In this case, the transmitter boosts (or pre-emphasizes) high-frequency components of the input signal prior to modulation and before noise is introduced.
Since the high-frequency components of the message were amplified at the transmitter, they must be returned to their original levels after demodulation. This is done by performing the inverse operation—de-emphasis—using a lowpass filter that attenuates the boosted frequencies. This process recovers the original message signal. Figure 4 shows the block diagram of an FM system incorporating pre-emphasis at the transmitter and de-emphasis at the receiver.
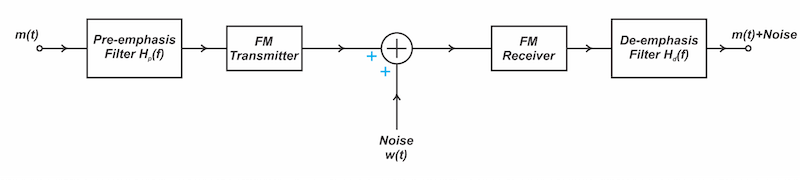
Figure 4. Using pre-emphasis and de-emphasis in FM systems.
How does PDE affect channel noise? Since noise is added after modulation, its high-frequency components aren’t boosted by pre-emphasis. However, when noise passes through the de-emphasis filter at the receiver, its high-frequency components are attenuated. Therefore, while the signal remains unchanged, the PDE technique reduces the noise power. We now analyze an FM configuration incorporating PDE to quantify its potential SNR improvement.
Impact of PDE on Output Noise Power
Under high carrier-to-noise ratio (CNR) conditions, the noise power spectral density at the output of a unity-gain discriminator without PDE is given by:
$$S_n(\omega) = \frac{\omega^2}{A_c^2} \times N_0 \quad for \quad |\omega| \leq \omega_m$$
Equation 1.
where:
Ac is the carrier amplitude
N0 is the one-sided power spectral density of the channel noise in Watts/Hz.
When analyzing the noise characteristics of FM demodulators, it’s often helpful to assume a discriminator gain factor of 1/2π. If we apply this assumption and reformulate the noise power spectral density in terms of frequency f measured in hertz, rather than angular frequency ω measured in radians per second, we obtain:
$$S_{n} (f) = \frac{1}{(2 \pi)^2} \times \frac{(2 \pi f)^2}{A_c^2} \times N_0$$
Equation 2.
which simplifies to:
$$S_{n} (f) = \frac{f^2}{A_c^2} \times N_0 \quad for \quad |f| \leq W$$
Equation 3.
For a message bandwidth of W hertz, the average output noise power is obtained by taking the integral of the noise power spectral density over -W to +W, leading to:
$$P_{n} = \int_{- W}^{+ W} \frac{N_0}{A_c^2}\times f^2 \ df = \frac{2 N_0 W^3}{3 A_c^2}$$
Equation 4.
Once the de-emphasis filter is applied, the noise spectrum is reshaped according to the squared magnitude of the filter’s frequency response. Hence, the noise spectrum changes from that shown in Equation 3 to:
$$S_{n, PDE} (f) = |H_{d}(f)|^2 \times S_{n} (f) = |H_{d}(f)|^2 \times \frac{N_0}{A_c^2} \times f^2 \quad for \quad |f| \leq W$$
Equation 5.
where Hd(f) represents the frequency response of the de-emphasis filter. By taking the integral of the above expression, we obtain the output noise power of an FM system with PDE as:
$$P_{n,PDE} = \int_{- W}^{+ W} \frac{N_0}{A_c^2}\times f^2 |H_{d}(f)|^2 \ df$$
Equation 6.
Impact of PDE on Signal Power
If Hp(f) denotes the frequency response of the pre-emphasis filter, then the de-emphasis filter must have the following response:
$$H_{d}(f) = \frac{1}{H_{p}(f)}, \quad -W < f < W$$
Equation 7.
The frequency characteristic of the de-emphasis network is the inverse of that of the pre-emphasis network. Figure 5 shows the frequency responses of pre-emphasis and de-emphasis filters used in commercial FM broadcasting.
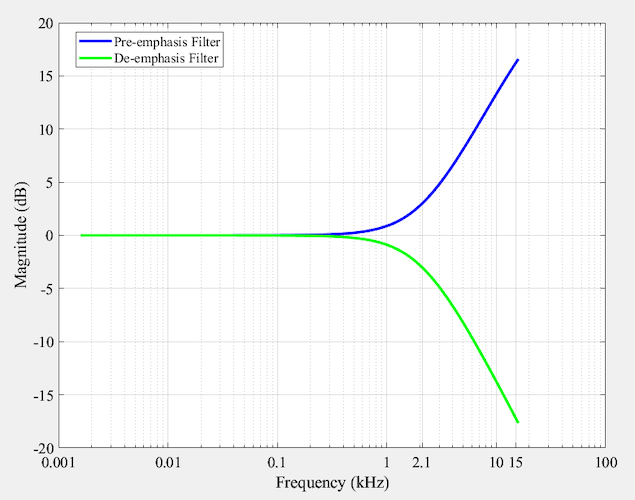
Figure 5. Typical 75-μs pre-emphasis and de-emphasis curves used in FM broadcasting.
The de-emphasis filter compensates for the spectral boosting applied during pre-emphasis. Therefore, the PDE process leaves the average message power essentially unchanged.
SNR Performance in FM Systems with PDE
With signal power unaffected, the evaluation of SNR improvement depends only on PDE’s impact on noise power. Dividing Equation 4 by Equation 6, the SNR improvement factor is obtained:
$$\begin{eqnarray}I = \frac{P_{n}}{P_{n,PDE}} &=& \frac{\frac{2 N_0 W^3}{3 A_c^2}}{\frac{N_0}{A_c^2} \int_{- W}^{+ W} f^2 |H_{d}(f)|^2 \ df} \\&=& \frac{2 W^3}{3\int_{- W}^{+ W} f^2 |H_{d}(f)|^2 \ df}\end{eqnarray}$$
Equation 8.
To solidify the above concepts, let’s evaluate the SNR improvement achieved through PDE in commercial FM broadcasting.
Example: Assessing the Impact of PDE on FM Broadcasting SNR
Assume that the de-emphasis filter is a simple first-order filter described by:
$$H_{d}(f) = \frac{1}{1+ j\frac{f}{f_1}}$$
Equation 9.
Calculate the SNR improvement as a function of the message bandwidth W and the filter corner frequency f1. Given a filter time constant of 75 µs and message bandwidth of W = 15 kHz, what is the theoretical SNR improvement resulting from PDE? Plot the output noise power spectral density shaped by the 75-µs de-emphasis filter.
Solution:
To calculate the SNR improvement factor described by Equation 8, we need to calculate the following integral:
$$\int_{- W}^{+ W} f^2 |H_{d}(f)|^2 \ df = \int_{- W}^{+ W} f^2 \times \frac{1}{1+(f/f_1)^2} \ df$$
Equation 10.
Using the following identity:
$$\int \frac{1}{1+x^2} \ dx = tan^{-1}(x)$$
Equation 11.
and performing a variable transformation, we evaluate the integral in Equation 10 as:
$$\int_{- W}^{+ W} f^2 \times \frac{1}{1+(f/f_1)^2} \ df = 2 \times f_{1}^3 \Big [(\frac{W}{f_{1}}) - tan^{-1}(\frac{W}{f_{1}}) \Big ]$$
Equation 12.
Hence, the SNR improvement factor defined in Equation 8 simplifies to:
$$\begin{eqnarray}I &=& \frac{2 W^3}{3\int_{- W}^{+ W} f^2 |H_{d}(f)|^2 \ df} \\&=& \frac{2 W^3}{3 \times 2 \times f_{1}^3 \Big [(\frac{W}{f_{1}}) - tan^{-1}(\frac{W}{f_{1}}) \Big ]} \end{eqnarray}$$
Equation 13.
Figure 6 uses the above expression to plot the SNR improvement I against W/f1.
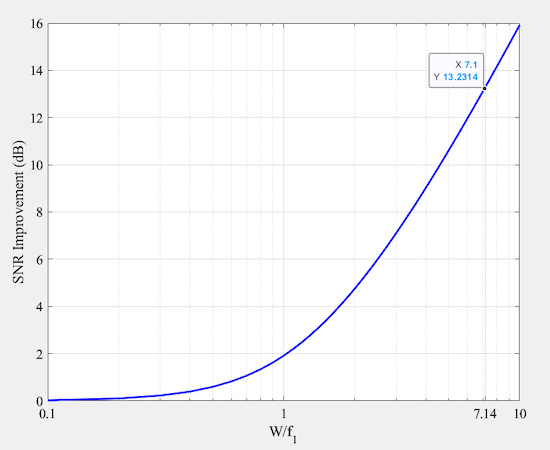
Figure 6. SNR improvement using PDE.
A time constant of 75 µs, which is commonly used in FM broadcasting, yields f1 = 2.1 kHz as calculated below:
$$f_1 = \frac{1}{2 \pi \times 75 \times 10^{-6}} = 2.1 \ kHz$$
Equation 14.
With f1 = 2.1 kHz and W = 15 kHz, the SNR improvement factor works out to I = 21.3, which corresponds to an SNR improvement of 13.3 dB. Without pre-emphasis and de-emphasis, the output SNR of a typical FM receiver ranges from 40 to 50 dB. We therefore see that simple pre-emphasis and de-emphasis filters can significantly improve the receiver's noise performance. Figure 7 provides a plot of the noise spectral density after the de-emphasis filter.
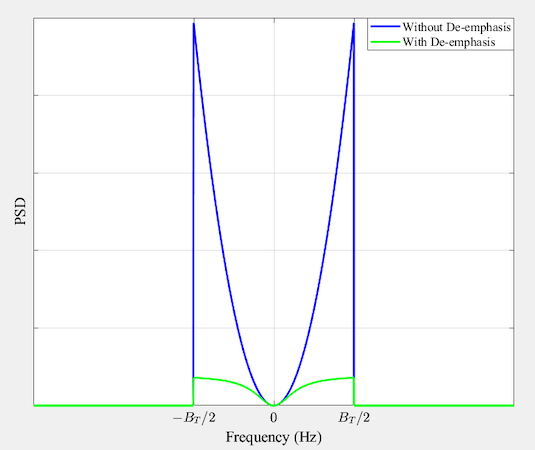
Figure 7. Noise power spectral density after the 75-µs de-emphasis filter.
Overmodulation Risk in FM Pre-Emphasis
While pre-emphasis enhances high-frequency components to improve noise resilience, it introduces a practical constraint: excessive boosting can lead to overmodulation. For instance, Figure 5 illustrates that pre-emphasis can amplify a 15 kHz signal by as much as 17 dB, potentially driving the instantaneous frequency deviation beyond acceptable bounds. In the next article, we’ll examine this constraint more closely and show that the actual SNR improvement achievable with a 75-µs de-emphasis filter is approximately 6.4 dB—a significant gain, yet considerably lower than the 13.3 dB theoretical value calculated earlier.
Wrapping Up
FM systems improve noise performance by boosting high-frequency signal components at the transmitter and attenuating them at the receiver. This pre-emphasis/de-emphasis strategy shows how exploiting spectral differences between signal and noise can improve overall system fidelity. Even simple implementations of these filters can substantially improve receiver noise performance.
Related Content