Facebook
 Google
 GitHub
 Linkedin
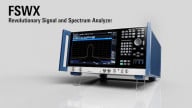
RIGOL Introduces New Vector Signal Analysis Application for RSA5000 Spectrum Analyzer Family
RIGOL's RSA5000 spectrum-analyzer series just got an RF upgrade. Learn more about vector signal analysis!
RIGOL's RSA5000 spectrum-analyzer series just got an RF upgrade. Learn more about vector signal analysis!
With the growth of the IoT, RF functionality has skyrocketed in demand. According to Michael Rizzo, General Manager of RIGOL North America, this trend "has created an ever more complex RF environment as more data is pushed through an already crowded spectrum."
To aid engineers with the challenges of designing in this environment, RIGOL has announced that a new VSA (vector signal analyzer) has been released to extend the capability of the company’s RSA5000 family of spectrum analyzers.

RIGOL's RSA5000 series spectrum analyzer just got an upgrade. Image from RIGOL
The application extends the capabilities of the RSA5000 to complex signal analysis and demodulation. This is suitable for the characterization of complex RF modulation schemes, such as QAM and QPSK as well as ASK, MSK and FSK signals.
Important Features of the VSA App
The VSA gives engineers the ability to utilize up to 13 integrated measurement functions including:
- I/Q waveform and RF envelope
- Constellation and vector diagrams
- Symbol level decode
- Time and frequency
- Bit error analysis
Comparisons against known sequences will provide quick insight into signal behaviors.
The VSA application offers preinstalled instrument setup for standards including:
- GSM
- W-CDMA
- Bluetooth
- Zigbee
- 802.11b
- APCO 25
For engineers working with common cellular, wireless, and terrestrial radio standards, these features may allow for quicker test setup, as well as streamlining the debugging process.
Digital Demodulation
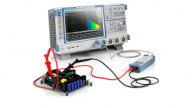
Users may opt to use the digital demodulation menu format. Next, they'll need to choose a modulation format and the signal is fed into the spectrum analyzer. The screen of the spectrum analyzer divides itself into four quadrants, as depicted in the diagram below.

VSA measurement application running on an RSA5000 spectrum analyzer. Image from RIGOL
Top left is the constellation diagram and below that is the spectrum. Top right is a symbol table of the data being demodulated and a summary table of error characteristics is displayed in the bottom right.
The user can choose from various types of complex modulations. There are also a wide variety of triggers that can be opted for.
RIGOL provides a useful video describing the VSA measurement application, which you can check out below.
Around the Industry
Just as there are many manufacturers who build spectrum analyzers, there are also many sources of software to augment the devices. Some providers design software to work specifically with their devices, while other software is more generic in nature.
- SpectraScopeRT from Gage-Applied is a Windows-based spectrum analyzer application that allows for integrated operational control for signal capture, analysis, recordings. Analysis displays include IQ Time Domain, Frequency Domain, I Spectrum, IQ Power Spectrum, Constellation Plot, Spectrogram Plot, Persistence Plot, and Histogram Plot.
- Spike Spectrum Analyzer Software from Signal Hound is designed to work Signal Hound spectrum analyzers. It enables the unit into a vector signal analyzer with its new digital modulation analysis capabilities.

Digital demodulation for all Signal Hound spectrum analyzers. Image from Signal Hound
Are you one of the many EEs being increasingly asked to characterize RF? Tell us about your experiences in the comments below.