Facebook
 Google
 GitHub
 Linkedin
The Exponential Current–Voltage Relationship in Forward-Conducting Diodes
This article provides foundational information on the electrical behavior of forward-biased diodes.
This article explains the exponential current–voltage (I–V) characteristic in reference to diodes, the concept of "thresholds," and the role of temperature in I–V curves.
The Diode Current–Voltage Relationship
When you apply a voltage across the two terminals of a diode, with the higher voltage on the anode side and the lower voltage on the cathode side, forward current (i.e., current from anode to cathode) will flow. If the voltage increases, the forward current will increase, and in this way, a diode is similar to a resistor: more voltage leads to more current.
However, if we look carefully at the way in which the current increases, we see that diodes are very different from resistors. If we apply a steadily increasing voltage to a resistor, we will obtain a steadily increasing current. With a diode, on the other hand, a steadily increasing voltage will produce a current that increases slowly at first, then more quickly, and eventually very quickly.
This occurs because the relationship between a diode’s forward voltage and its forward current is exponential rather than linear.
The following plot of diode current (ID) vs. diode voltage (VD) depicts the exponential current–voltage characteristic of a typical silicon diode.
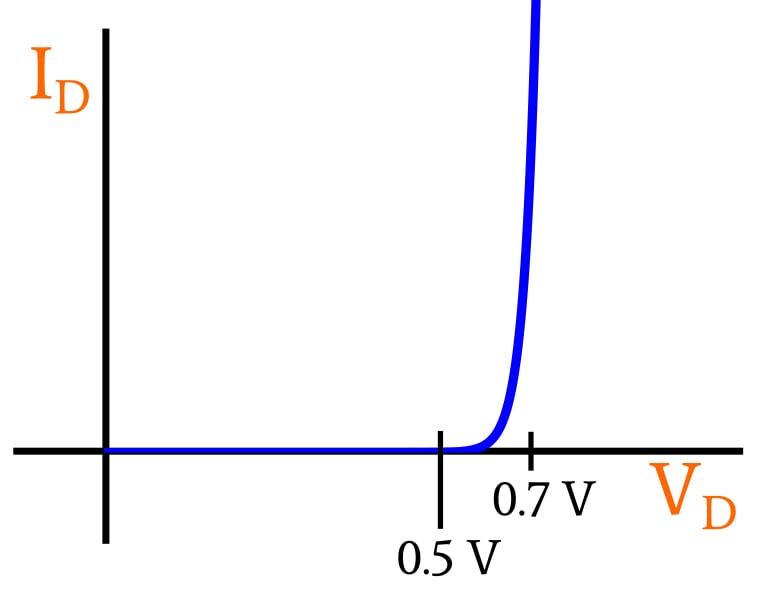
As you can see, almost no forward current flows when the forward voltage is below 0.5 V. This is the region in which current increases slowly relative to the increase in voltage.
A transition region, in which the rates of voltage change and current change are more comparable, begins around 0.5 V. This transition region is narrow, though, and by the time VD has reached 0.7 V, diode current is increasing so rapidly that very small changes in forward voltage create large changes in forward current.
Forward-Voltage “Thresholds”
As the plot above demonstrates, the relationship between a diode’s current and voltage is not discontinuous. The relationship is exponential rather than linear, but current nonetheless increases smoothly from zero to large values. Thus, there are no true “thresholds” in a diode’s electrical behavior, if we interpret “threshold” as some sort of instantaneous transition from one state (such as “non-conducting”) to another state (such as “conducting”).
That being said, the exponential nature of a diode’s I–V characteristic leads to voltage values that are quite similar to thresholds in the context of practical engineering work. Thus, it is often convenient to discuss the two voltages called out in the diagram as though they are thresholds.
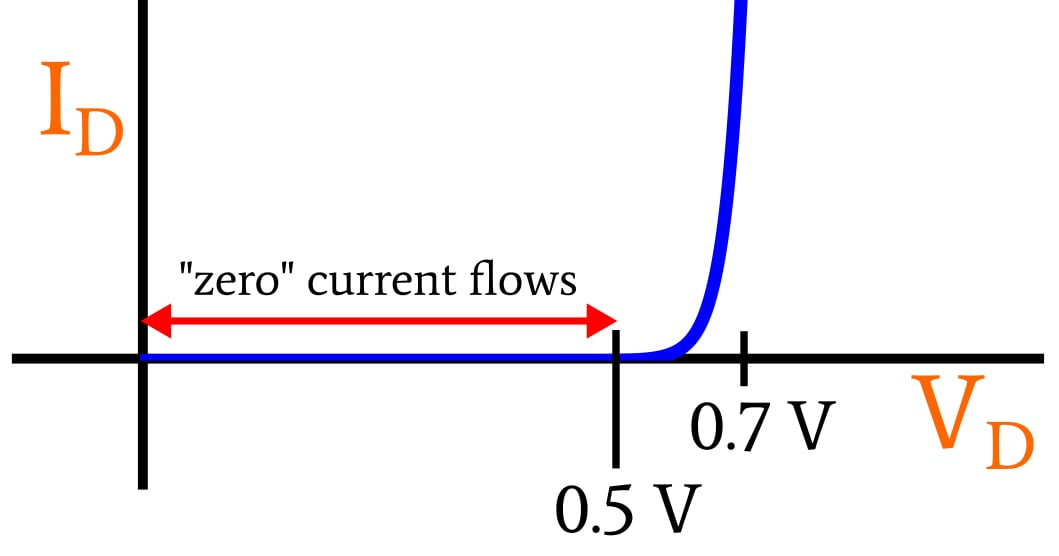
The first threshold, 0.5 V, identifies the transition from negligible current flow to non-negligible current flow. Thus, when we’re discussing practical circuits instead of precise scientific details, we can say that a typical silicon diode does not allow current to flow until the forward voltage has exceeded 0.5 V.
The second threshold, 0.7 V, identifies the point at which the slope of the I–V curve has become extremely high; we can use 0.7 V as an approximation of the voltage dropped by a fully conducting silicon diode because voltages that are significantly higher than 0.7 V would correspond to unusually large amounts of current.
Low-Power vs. High-Power Diodes
The plots shown above, which convey the general I–V relationship of a silicon pn-junction diode, do not indicate exact current values. They don’t tell us how much forward current is flowing when the diode’s forward voltage is, for example, 0.5 V or 0.7 V. This is necessary, because the precise numerical relationship between forward voltage and forward current depends on the physical dimensions of a given diode.
More specifically, the cross-sectional area of the pn junction strongly influences the amount of forward current that flows relative to forward voltage. Thus, a physically small diode that is intended for low-power applications might have 5 mA of forward current when its forward voltage is 0.7 V, and a larger diode intended for high-power applications might have ID = 500 mA at VD = 0.7 V.
Temperature Dependence of the I–V Curve
Another factor that influences the precise numerical relationship between forward voltage and forward current is temperature. The voltage value that corresponds to a given current value increases as temperature decreases. In other words, if a circuit maintains a diode current of, say, 15 mA, the diode’s voltage drop at 10°C will be higher than its voltage drop at 20°C.
The following diagram depicts this temperature dependence as a horizontal shifting of the I–V curve.
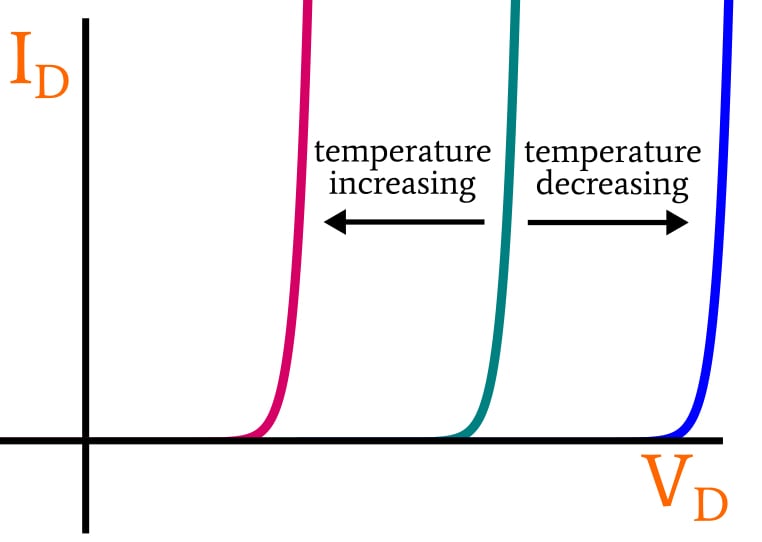
The diode’s I–V curve shifts by approximately 2 mV per degree Celsius.
Conclusion
I hope that this article has helped you to understand the relationship between a forward-biasing voltage applied to a diode and the current that flows in response to that applied voltage.
In the next article, we’ll continue this topic by considering forward-conducting diodes within the context of circuit analysis.