 Facebook
 Google
 GitHub
 Linkedin
Modeling ADCs Using Effective Number of Bits (ENOB)
Learn about the concept of ENOB (effective number of bits) and how it can be used in modeling data converters in system simulations.
In the previous article in this series on modeling data converters, we discussed the basic concepts of models for ADCs and broached the subject of how to choose an input signal for implementing a model. (Please note that this initial article includes an important list of abbreviations, glossaries, and references.)
Here, we'll continue that conversation by addressing one figure-of-merit often used for data converters, the “effective number of bits” or ENOB ([4] to [8]).
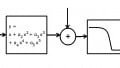
ENOB is defined as the number of bits an ideal quantizer would have to perform the same as a data converter under the same conditions. The model shown in Figure 1 could be used with NE = ENOB.
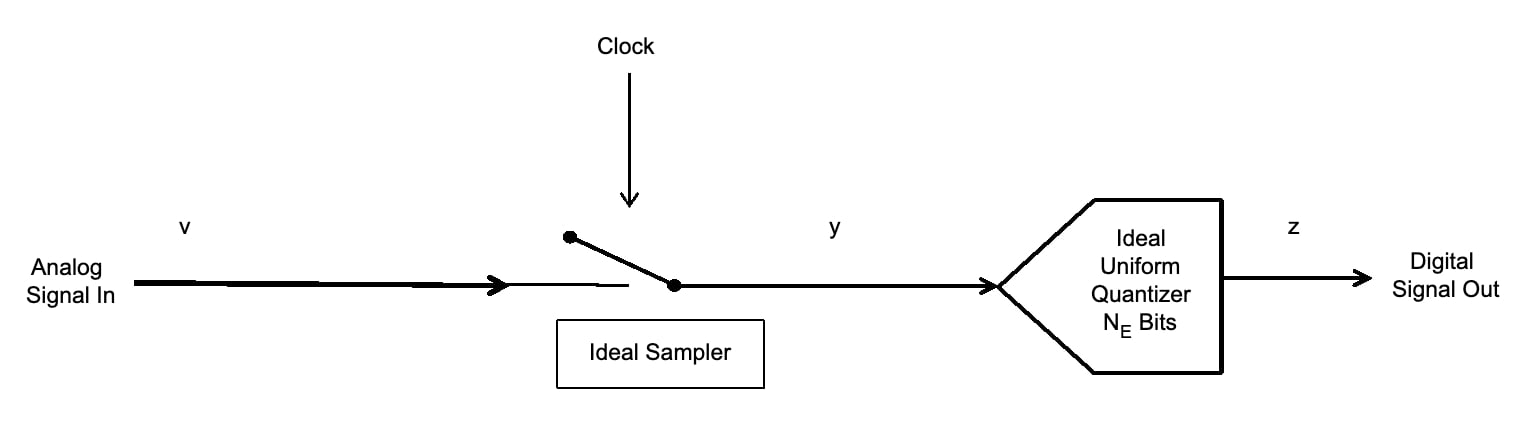
Figure 1. Model of an ADC
The questions arise; “What are those conditions, and are they the same for the application to be used? Are there different definitions of ENOB that should be used for different applications?
Usually ENOB is defined with a 0 dBpeakFS sine wave input at a given frequency [8]. It is usually a function of frequency. Let the LSB voltage be L, and the ideal ADC have N bits.
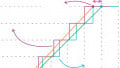
Referring back to Figure 2, the peaks of the sine wave are at FS+ = L((2N/2)-1) and FS- = −L(2N/2).
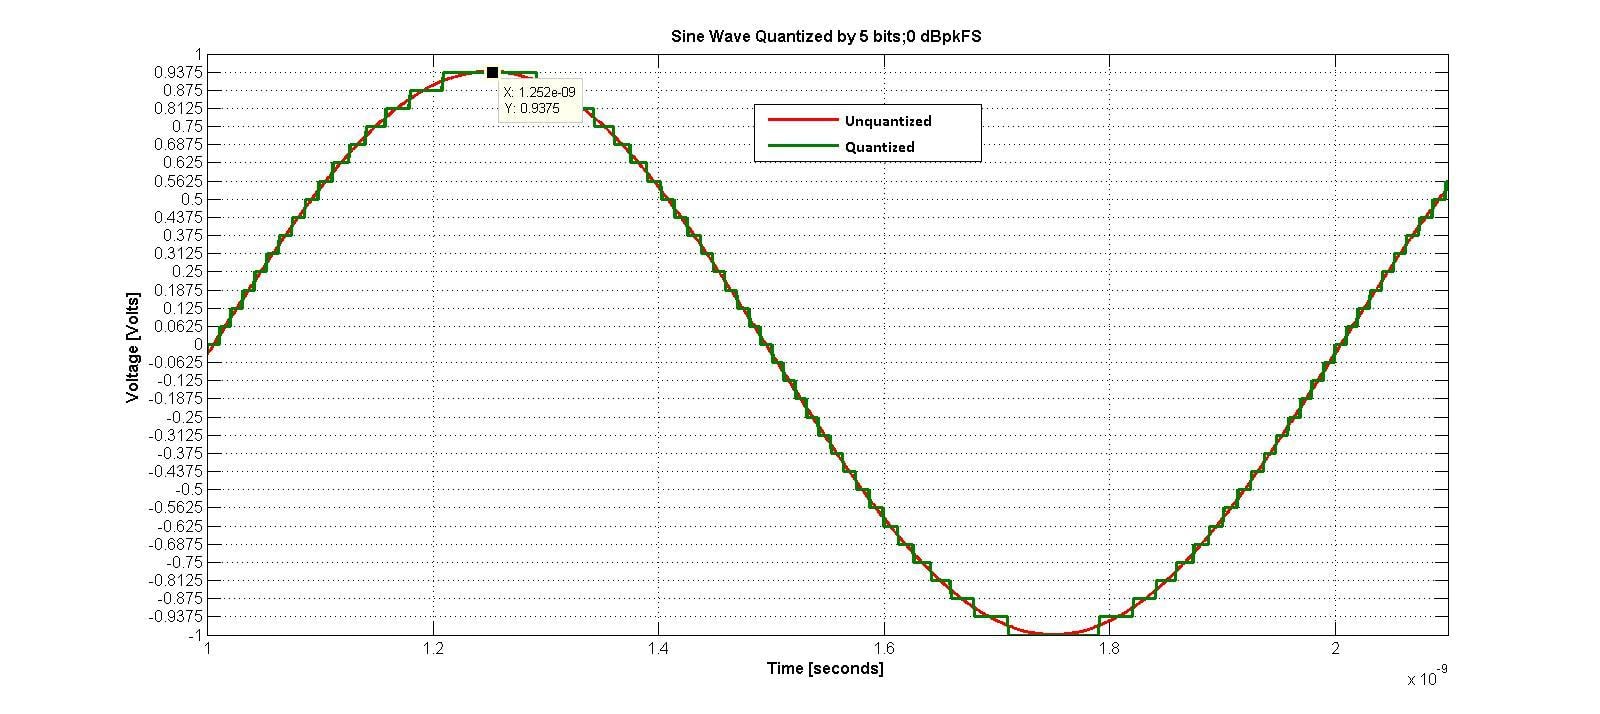
Figure 2. Figure 2 from our previous article on how data converters should be modeled for system simulations
For N ≥ 5; the error in assuming L((2N/2)-1) = L(2N/2) is less than 7%, so let’s do it. If the peak of the sine wave is L(2N/2); its mean square (ms) value is L2(22N/8). It is also known that, for a random input to an ideal ADC, the mean square (ms) quantization noise = L2/12 ([2], equation 1.14); this is noise in the entire Nyquist zone (0 to FNyquist). But we have a sine wave, not a random input. Your author wondered if the same quantization noise is valid for a sine wave, as well as other inputs the ADC might see, so did some simple simulations.
The results are shown in Table 1.
Table 1. Mean square of quantization errors for difference waveforms into quantizer, no time sampling
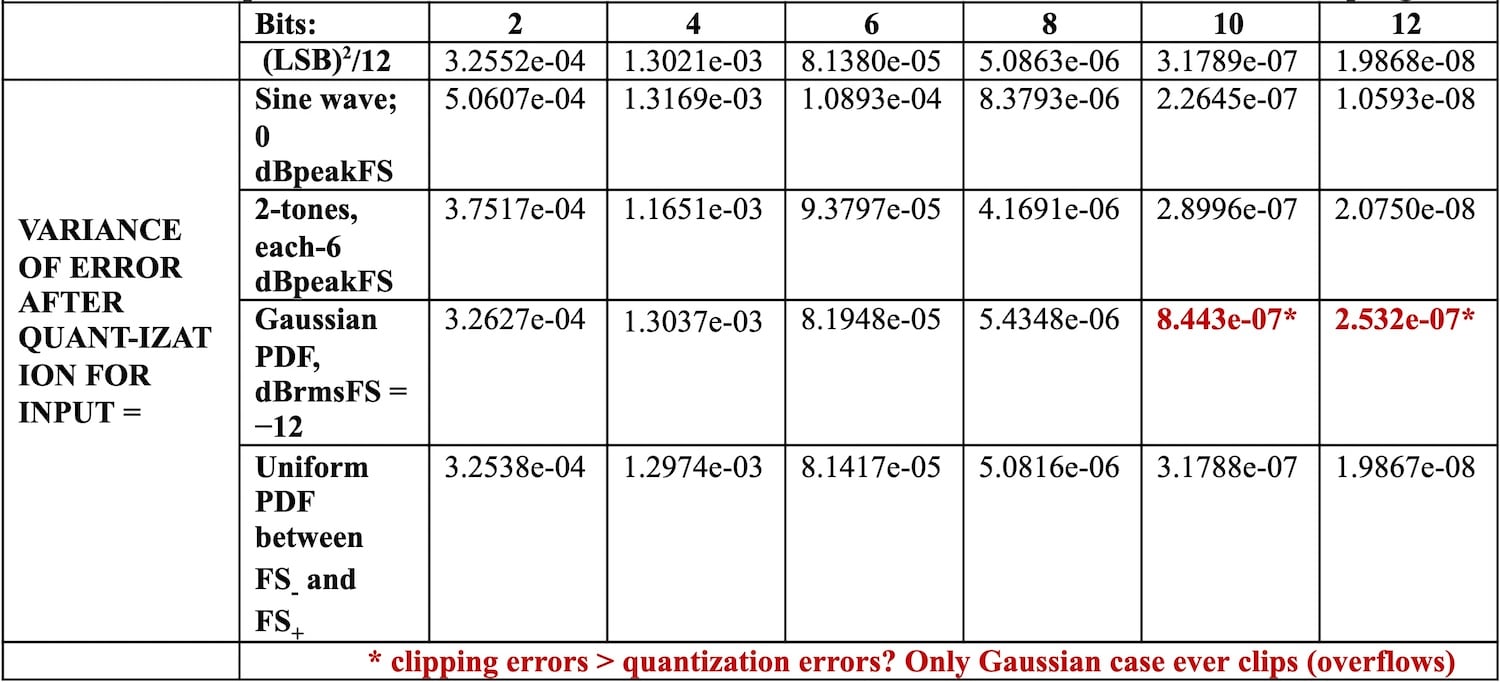
For 2 to 12 bits, the mean square noise is shown using the formula L2/12; and compared to the mean square noise observed for various inputs. Even for a single sine wave, the results are fairly close. The only place a discrepancy was noted was for a Gaussian input, at –12 dBrmsFS, for 10 and 12 bits; where the noise due to quantization alone would be low. However, the peaks of the Gaussian noise caused clipping (overloading), which increased the noise.
{As an interesting, aside added in version .02 of this document, the exact expression for the mean square value of quantization noise with a 0 dBpeakFS sinusoidal input was derived by Grey [18A] as:
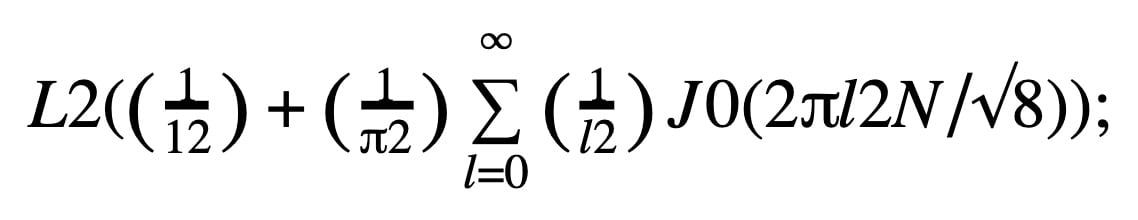
where J0 is the ordinary Bessel function of order 0. For large x, J0(x) → 0; and it is L2/12.}
So, the signal-to-noise ratio (SNR)
SNR = ms(signal)/ms(noise) = (1.5)(22N)
or, in dB
SNRdB = 6.0206N + 1.7609
Equation 1
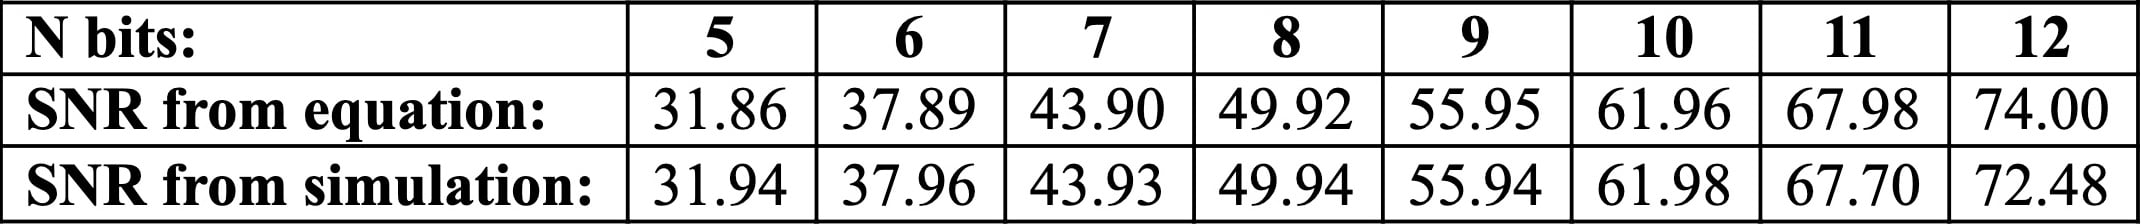
An ADC consisting of a sampler and an ideal N bit quantizer was simulated, and the results are shown in Table 2 for 5 to 12 bits. The input sine was not synchronous with the ADC clock. The results are remarkably close to Equation 1.
Table 2. SNR calculated from Equation 1 and by sine wave through simulated ADC
For a real ADC, the signal-to-noise and distortion ratio (SINAD) in the entire Nyquist zone is substituted for SNR in Equation 1, and the result solved for N, which is now called the effective number of bits = NE.
NE = (SINADdB - 1.7609)/ 6.0206 ≈ (SINADdB - 1.76)/ 6.02
Equation 2
Note that SINAD includes all distortion terms for the ADC, including distortion due to non-linearity. For inputs at less than full scale, the distortion of the ADC decreases. Manufacturers will often measure SINAD at some input level –B dBpeakFS (peak signal is B dB below full scale). Since the test input signal is lower by B dB they will then add this value to calculate ENOB as if the distortion would not increase for a larger input.
NE = (B + SINADdB - 1.76)/ 6.02
Bogus Equation
However, this equation is bogus, because it ignores the fact that distortion will increase, usually faster than the signal. For a simple 3rd order non-linearity, for every 1 dB increase in signal, the distortion increases by 3 dB, so SINAD would be 2 dB worse.
Because intermodulation is so important, and following the advice of the "Choice of an Input Signal for Implementing a Model" section of our previous article: a 2-tone input signal should be used.
The difference between measuring noise and distortion in the entire Nyquist zone and in the “interesting bandwidth” also needs to be explored. Figure 3 shows the 2-tone test signal.
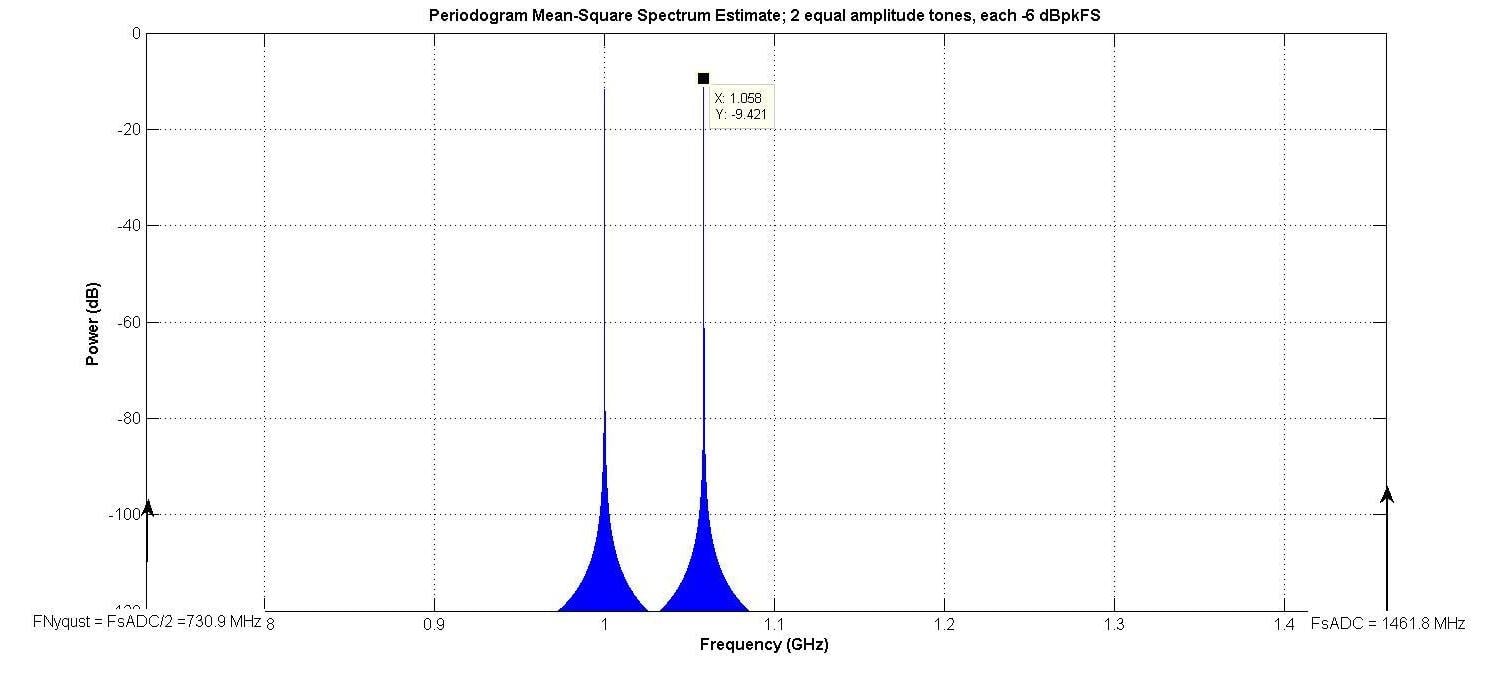
Figure 3.
Since fS = 1461.8 MHz, fNyquist = 730.90 MHz. So, the signals are in the 2nd Nyquist zone. Note that the input to the ADC can be divided into Nyquist zones. Since the ADC output is time sampled, frequencies above the 1st Nyquist zone do not exist, so that is just called the Nyquist zone.
A 1-tone test signal at 1000 MHz was also used. The “interesting bandwidth” was arbitrarily defined as 233.7 MHz, centered at the center of the two tones. The model of Figure 1 was simulated; with NE being the number of bits in the ideal quantizer.
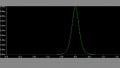
Figure 4 shows the output for the 2-tone test, with an 8 bit ADC modeled. Since there are no distinct spurious tones (spurs), the SINAD for both the 1- and 2- tone input cases is equal to the SNR.
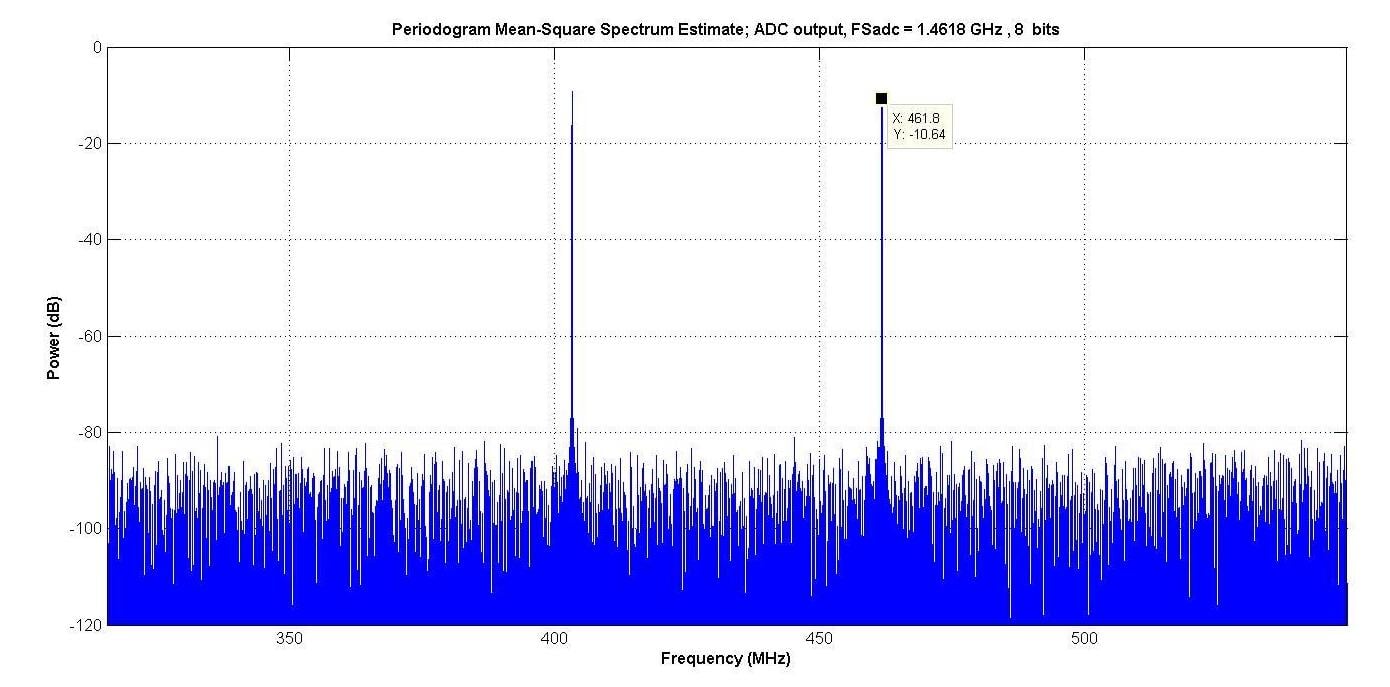
Figure 4.
When we plot the SINAD determined at a function of bits, there are two observations.
First, the difference between the Nyquist bandwidth and the “interesting bandwidth” is 3.1275; which corresponds to 4.95 dB. Since this is approximately the difference between curves for Nyquist bandwidth and the “interesting bandwidth” for the same input; this is consistent with the assumption that the quantization noise spectrum is white.
Second, in order for the peaks to be at 0 dBpeakFS, the average power of the 2-tone case must be ½ that of the 1-tone case. The difference between the 1- and 2- tone curves for the same bandwidth is approximately 3 dB.
It also shows a good match to Equation 2, for the 1-tone input. Two different ENOBs can be defined, relating the measured SINAD with a 1-tone (ENOB1) and 2-tone (ENOB2) input
ENOB1 ≡ (SINADN1 - 1.76)/6.02
Equation 3(a)
ENOB2 ≡ (SINADN2 +1.25)/6.02
Equation 3(b)
where SINADNi is the SINAD measured, in dB for the full Nyquist bandwidth, for i input tones. For the model of Figure 1, the two ENOBs will be equal.
The next article in this series will address another model, one that uses the intermodulation polynomial and effective number of bits.


Some of the superscripts and subscripts did not come out correctly as this article was published on the web. Since superscripts and subscripts might not appear correctly in comments, I will use the following conventions:
X^(Y) denotes X to the Y power, so L^(2) is L squared.
Q\/(r) denotes Q with the subscript r, so FS\/(-) denotes FS with a subscript “-” (negative Full Scale).
Starting with the 6th paragraph:
Referring back to Figure 2, the peaks of the sine wave are at FS\/(+) = L(((2^(N))/2)-1) and
FS\/(-) = −L((2^(N))/2).
For N ≥ 5; the error in assuming L(((2^(N))/2)-1) = L((2^(N))/2) is less than 7%, so let’s do it. If the peak of the sine wave is L((2^(N))/2); its mean square (ms)value is (L^(2))((2^(2N))/8). It is also known that, for a random input to an ideal ADC, the mean square (ms) quantization noise = (L^(2))/12 ([2], equation 1.14);this is noise in the entire Nyquist zone (0 to FNyquist). But we have a sine wave, not a random input. Your author wondered if the same quantization noise is valid for a sine wave, as well as other inputs the ADC might see, so did some simple simulations. The results are shown in Table 1.
For 2 to 12 bits, the mean square noise is shown using the formula (L^(2))/12; and compared to the mean square noise observed for various inputs. Even for a single sine wave, the results are fairly close. The only place a discrepancy was noted was for a Gaussian input, at –12 dBrmsFS, for 10 and 12bits; where the noise due to quantization alone would be low. However, the peaks of the Gaussian noise caused clipping (overloading), which increased the noise.
{Since superscripts and superscripts are difficult to render in complicated equations, the reader interested in a more theoretical justification of the mean square value of quantization noise with a 0dBpeakFS sinusoidal input is encouraged to consult equation (37) and the subsequent discussion in reference [18A]; Gray, Robert M.; “Quantization Noise Spectra”; Information Theory, IEEE Transactions on; Vol. 36, No. 6; Nov.1990; pages 1220 to 1244.}
The text starting at “So, the signal-to-noise ratio (SNR)...” is correct.
Thanks so much for these excellent contributions, many times I have wanted to followup on these sorts of issues and it’s great to see someone else has done it, and done it well.
Regarding equation 3b (the enob for dual tone) - do you have a reference for this?