This page explores the use of quadrature demodulation with frequency- and phase-modulated signals.
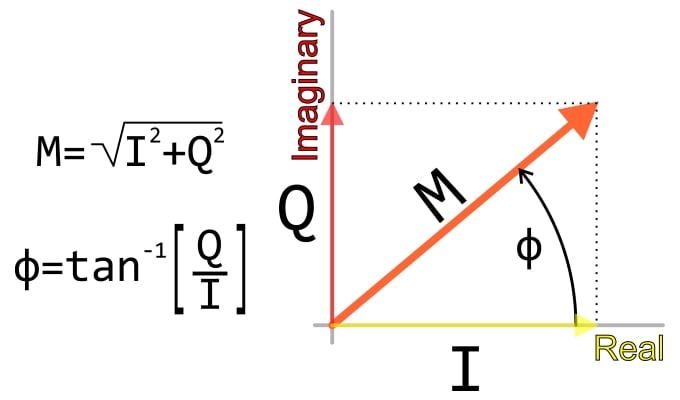
From the previous page we know that quadrature demodulation produces two baseband waveforms that, when taken together, convey the information that was encoded into the carrier of the received signal. More specifically, these I and Q waveforms are equivalent to the real and imaginary parts of a complex number. The baseband waveform contained in the modulated signal corresponds to a magnitude-plus-phase representation of the original data, and quadrature demodulation converts that magnitude-plus-phase representation into I and Q signals that correspond to a Cartesian representation.
It is perhaps not very surprising that we can use quadrature demodulation to demodulate AM signals, considering that a quadrature demodulator is simply two amplitude demodulators driven by carrier-frequency reference signals that have a 90° phase difference. However, one of the most important characteristics of quadrature demodulation is its universality. It works not only with amplitude modulation but also with frequency and phase modulation.
First let’s look at the I and Q waveforms that are produced when we apply quadrature demodulation to frequency modulation. The received FM waveform is a 100 kHz carrier modulated by a 100 Hz sinusoid. We’re using the same quadrature demodulator that was used in the AM simulation; it has two arbitrary behavioral voltage sources for performing the multiplication, and each voltage source is followed by a two-pole low-pass filter (the cutoff frequency is ~1 kHz). You can refer to the page on How to Demodulate an FM Waveform for information on how to create an FM signal in LTspice.
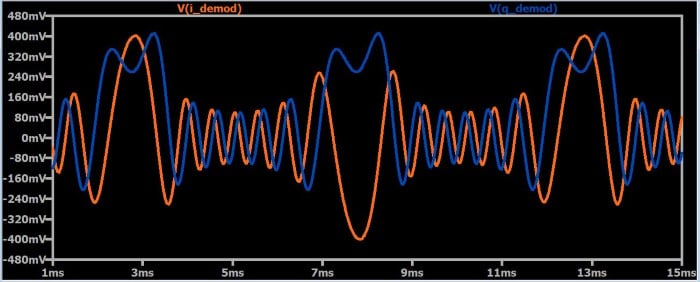
Perhaps the common reaction to this plot would be confusion. What do these odd-looking signals have to do with the constant-frequency sinusoid that should result from the demodulation process? First let’s make two observations:
Now that we have I/Q signals, we need to somehow process them into a normal demodulated waveform. Let’s first try the approach that we used with amplitude modulation: use a bit of math to extract the magnitude data.
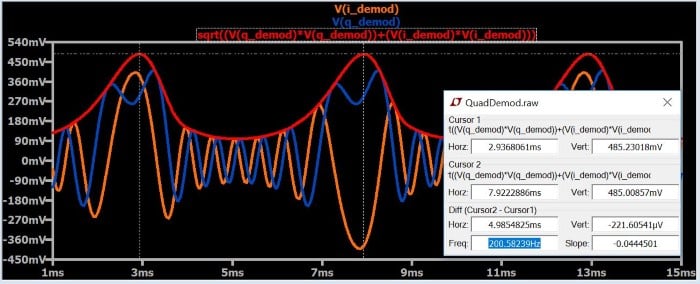
Clearly this didn’t work: the magnitude signal (the red trace) doesn’t look like a sinusoid, and the frequency is incorrect (200 Hz instead of 100 Hz). After further consideration, though, this is not surprising. The original data is characterized by magnitude and phase; when we apply the √(I2 + Q2) computation, we are extracting the magnitude. The trouble is, the original data was not encoded in the magnitude of the carrier—it was encoded in the angle (remember that frequency modulation and phase modulation are two forms of angle modulation).
So let’s try a different computation. Let’s extract the angle of the I/Q data rather than the magnitude. As shown in the right-triangle diagram above, we can do this by applying the following equation:
$$\phi=\arctan\left(\frac{Q}{I}\right)$$
Here is the result:
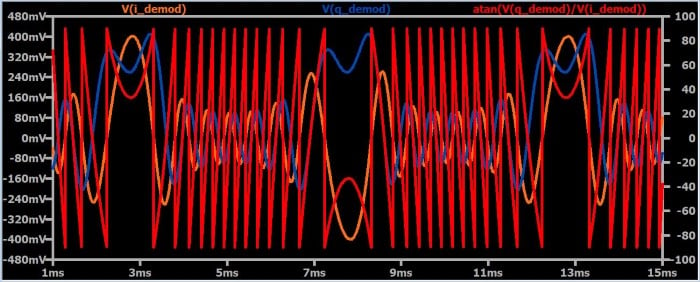
This doesn’t look good, but we are actually getting close. The red trace represents the instantaneous phase of the original data. (Note that the trace seems more erratic than it really is because the angle is jumping from –90° to +90°, or vice versa). Frequency modulation, though based on phase, does not encode information directly in the phase of the carrier. Rather, it encodes information in the instantaneous frequency of the carrier, and instantaneous frequency is the derivative of instantaneous phase. So what happens if we take the derivative of the red trace?
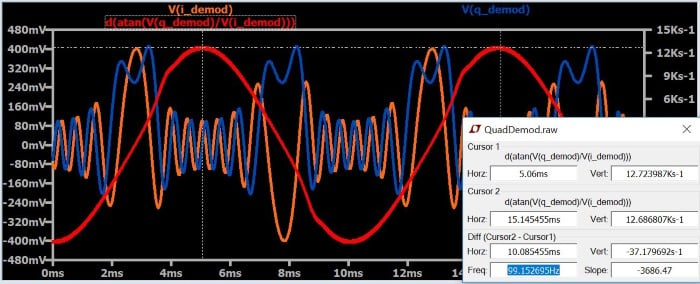
As you can see, we have now recovered a waveform that is sinusoidal and has the same frequency as the original baseband signal.
At this point you might be wondering why anyone would want to bother with I/Q demodulation. How in the world would anyone design a circuit that generates an output signal corresponding to the derivative of the arctangent of two input signals? Well, to answer the question posed in the title of this section, you digitize the signals and compute the arctangent in firmware or software. And this brings us to an important point: Quadrature demodulation is especially advantageous in the context of software-defined radios.
A software-defined radio (SDR) is a wireless communication system in which significant portions of the transmitter and/or receiver functionality are implemented via software. Quadrature demodulation is highly versatile and enables a single receiver to almost instantaneously adapt to different types of modulation. The I/Q output signals, however, are far less straightforward than a normal baseband signal produced by standard demodulator topologies. This is why a quadrature demodulator and a digital signal processor form such a high-performance receiver system: the digital signal processor can readily apply complicated mathematical operations to the I/Q data produced by the demodulator.
The same general considerations that we discussed in the context of quadrature frequency demodulation apply also to quadrature phase demodulation. However, to recover the original data we take the arctangent of (Q/I) rather than the derivative of the arctangent of (Q/I), because the baseband signal is encoded directly in the carrier’s phase rather than in the derivative of the phase (i.e., the frequency).
The following plot was generated by applying quadrature demodulation to a phase-shift-keying waveform consisting of a 100 kHz carrier and a 100 Hz digital baseband signal that causes the carrier’s phase to change by 180° according to whether the signal is logic high or logic low. As you can see, the red trace (whose value corresponds to the phase of the received waveform) reproduces the logic transitions in the baseband signal.
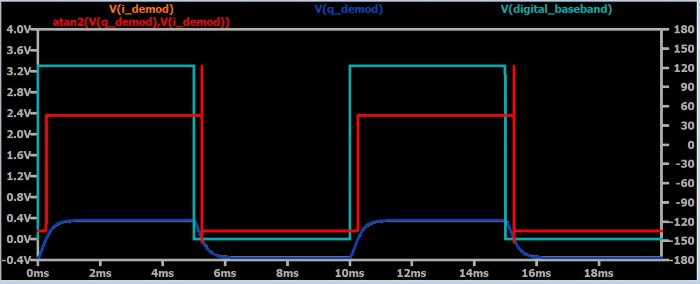
Notice that the red trace is computed via the “atan2” function. Standard arctangent is limited to two quadrants (i.e., 180°) of the Cartesian plane. The atan2 function looks at the individual polarities of the input values in order to produce angles covering all four quadrants.

In Partnership with Renesas Electronics

by Aaron Carman

by Aaron Carman


by IDENTCO

