Facebook
 Google
 GitHub
 Linkedin
Learning to Live in the Frequency Domain
Perhaps one of the most fundamental steps in the process of gaining proficiency in RF design is learning to think in the frequency domain. For most of us, the vast majority of our early experience with electrical circuits and signals remains within the context of voltages and currents that are either static or dynamic with respect to time. For example, when we measure the voltage of a battery with a multimeter, we have a static quantity, and when we look at a sinusoidal voltage on an oscilloscope, we have a time-varying quantity.
RF, on the other hand, is a world of frequencies. We do not send static voltages to antennas, and the oscilloscope is usually not an effective tool for capturing and visualizing the types of signal manipulation that are involved in wireless communication. Indeed, we can say that the time domain is simply not a convenient place for the design and analysis of RF systems. We need a different paradigm.
Fourier
The Fourier transform is the mathematical path that leads to this alternative paradigm, because it provides a precise method of describing a signal according to its frequency content.
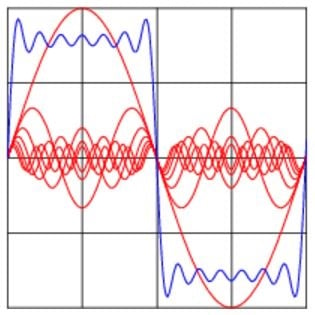
This diagram shows some of the frequency content (red) in a square wave (blue).
In the context of RF, the Fourier transform can take extremely complex signal variations and translate them into frequency-domain components that are far more informative than the original time-domain waveform.
The details involved in computing the Fourier transform or the discrete Fourier transform (DFT) are not trivial; however, this is not something we have to worry about at this point. You can understand and employ frequency-domain techniques even if you know very little about the underlying mathematical procedures.
The Fourier transform produces expressions that reveal a signal’s frequency content, and the DFT produces corresponding numerical data. However, in the context of practical engineering, a graphical representation is often much more convenient. Eventually these frequency-domain plots become as normal and intuitive as an oscilloscope trace.
The “Spectrum”
A frequency-domain plot is referred to as a spectrum. The idealized spectrum for a 1 MHz sinusoid is as follows:
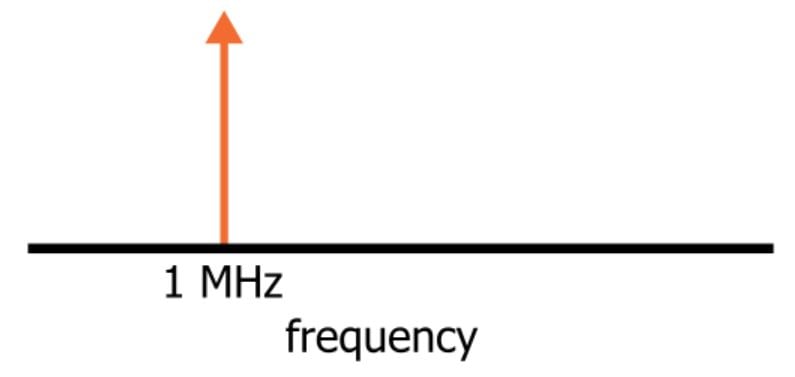
The vertical arrow indicates that a certain amount of “energy” is present at 1 MHz. The line portion of the arrow is so thin because this idealized signal has absolutely no other frequency components—all the energy is concentrated exactly at 1 MHz.
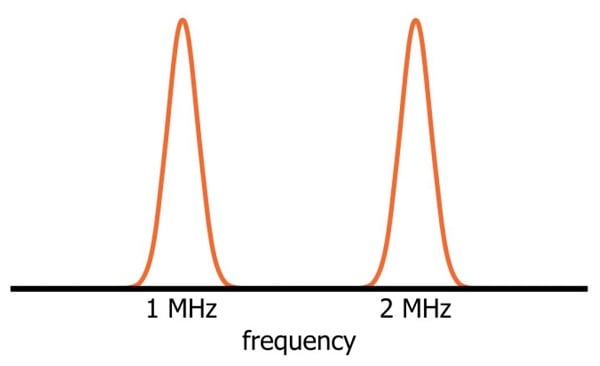
If we used a summing circuit to combine this perfect 1 MHz sinusoid with a perfect 2 MHz sinusoid, the spectrum would be the following:
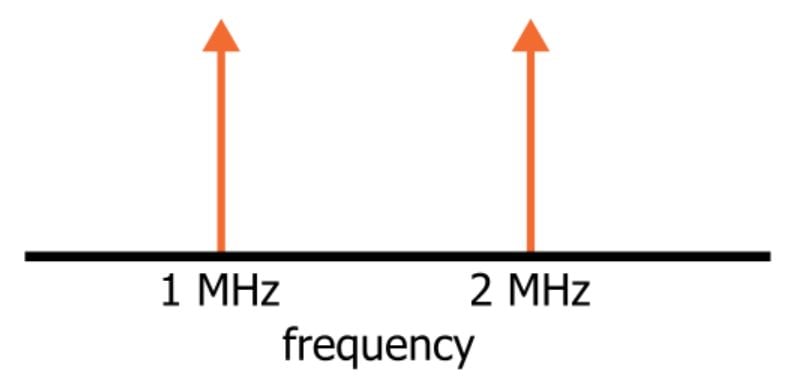
This frequency-domain plot provides very clear data regarding the frequency characteristics of our new signal. If you are primarily interested in the non-instantaneous frequency-related behavior of your circuit, the spectrum gives you the information you need. In contrast, the time-domain waveform is not straightforward:
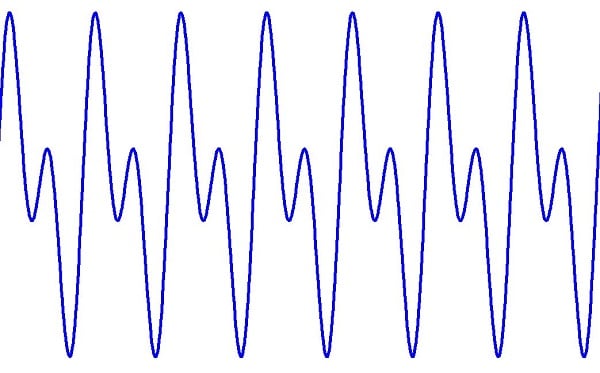
It is far less obvious that this trace is the result of adding one sinusoidal quantity of frequency f to a second sinusoidal quantity of frequency 2f.
Ideal vs. Real
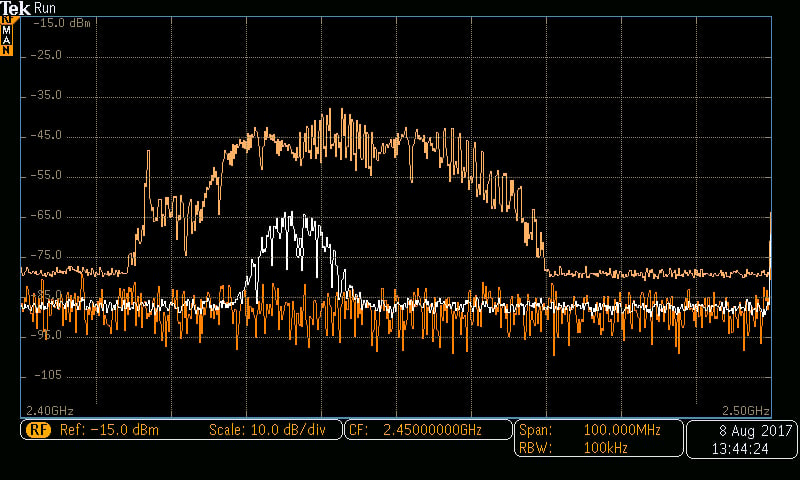
The thin-vertical-arrow frequency components shown above are mathematical constructs; real-world spectral measurements look more like this:
Why the discrepancy? First of all, the resolution of the measurement system is limited, and such limitations inherently compromise whatever “ideal” qualities might be present in the original signal. But even if we had an infinitely accurate measuring device, the spectrum would differ from the mathematical version because of noise.
The only type of signal that could produce the “pure” spectral components shown in the previous section is a perfect sinusoid—i.e., no noise and no variations in period or amplitude. Any deviation from the characteristics of a perfect sinusoid would introduce additional frequency components.
An intuitive example is phase noise: It is not practical to expect a real-world oscillator to always produce the exact same frequency; inevitably there will be (hopefully small) variations in the actual duration of a cycle, and this is called phase noise. If you collect data covering one thousand cycles and then perform spectral analysis, you are effectively averaging the frequency content of those one thousand cycles. The result will be the spectral shape shown above; the width of the waveform corresponds to the averaged deviation from the nominal frequency.
Spectral Measurements
Frequency-domain plots provide a very convenient means of discussing and analyzing RF systems. Modulation schemes, interference, harmonic distortion—even basic spectra drawn on a piece of scratch paper can really help to clarify a situation.
But we’ll generally need something more sophisticated when it comes time to successfully design an RF system. More specifically, we need something that gives us the spectral characteristics of an actual signal. This is important for characterizing the functionality of an existing system, but usually the more pressing need is diagnosis and resolution—i.e., why is this device not working, and how can we fix it.
Digital oscilloscopes offer “FFT” (fast Fourier transform) functionality, and this is one way to obtain spectral measurements. However, the tool of choice for real-world frequency analysis is called a spectrum analyzer. This is a piece of test equipment that is specifically designed to accept a high-frequency input signal and display the frequency-domain representation of this signal. Acquiring a bit of hands-on experience with a spectrum analyzer is an important initial step in becoming familiar with practical aspects of RF engineering.
Summary
- Engineers can interact with electrical signals via the time domain or the frequency domain. In the context of RF, it is generally more productive and intuitive to work in the frequency domain.
- Frequency-domain analysis naturally suppresses details that are often of little importance in RF design and testing, and at the same time it emphasizes the characteristics that we need to focus on.
- A frequency-domain plot is referred to as a spectrum. A spectrum can conveniently convey the salient characteristics of, for example, a modulation scheme or an actual signal that is experiencing problems caused by interference.
- Theoretical spectra often consist of thin vertical arrows that correspond to idealized fixed-frequency sinusoids.
- Real-world measurement equipment and real-world RF signals are always subject to imperfections that result in a wider frequency-domain waveform.
- An essential piece of equipment for an RF design lab is the spectrum analyzer. These devices provide frequency-domain plots as well as various signal-analysis capabilities.