 Facebook
 Google
 GitHub
 Linkedin
RC Time Constant Calculator
The time constant of a series RC circuit is the product of the resistance and capacitance. Given two of the three values—resistance, capacitance, or RC time constant—this tool will calculate the missing third variable.
Input
Charging Characteristics of a Series RC Circuit
In the circuit in Figure 1, a voltage source (VS) is initially isolated from a resistor (R) and capacitor (C) connected in series by an open switch. When the switch is closed, the capacitor will begin to charge, and the voltage across its terminals (VC) will increase exponentially.
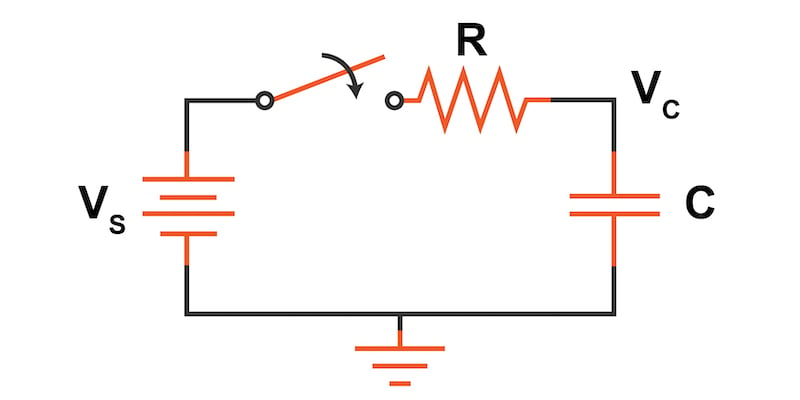
Figure 1. A series RC network charging circuit
The charging and discharging rate of a series RC networks are characterized by its RC time constant, $$\tau$$, which is calculated by the equation:
$$\tau = R · C$$
Where:
- $$\tau$$ is the time constant in s
- R is the resistance in Ω
- C is the capacitance in F
The voltage across the capacitor as it charges over time is given by the equation:
$$V_C = V_S · (1 - e^{(\frac{-t}{\tau})})$$
Where:
- VC is the voltage across the capacitor in V
- VS is the voltage of the source in V
- t is the time since the closing of the switch in s
- $$\tau$$ is the RC time constant in s
Using that equation, we can construct the following table to see how the voltage across the capacitor changes with time.
Table 1. Voltage charging values for an RC series network.
| Ratio (t/RC) | 1 | 2 | 3 | 4 | 5 |
|---|---|---|---|---|---|
| Vc (% of Vs) | 63.21 | 86.47 | 95.02 | 98.17 | 99.33 |
After one time constant, the capacitor has charged to 63.21% of what will be its final, fully charged value. After a time period equal to five time constants, the capacitor should be charged to over 99%. We can see how the capacitor voltage increases with time in Figure 2.
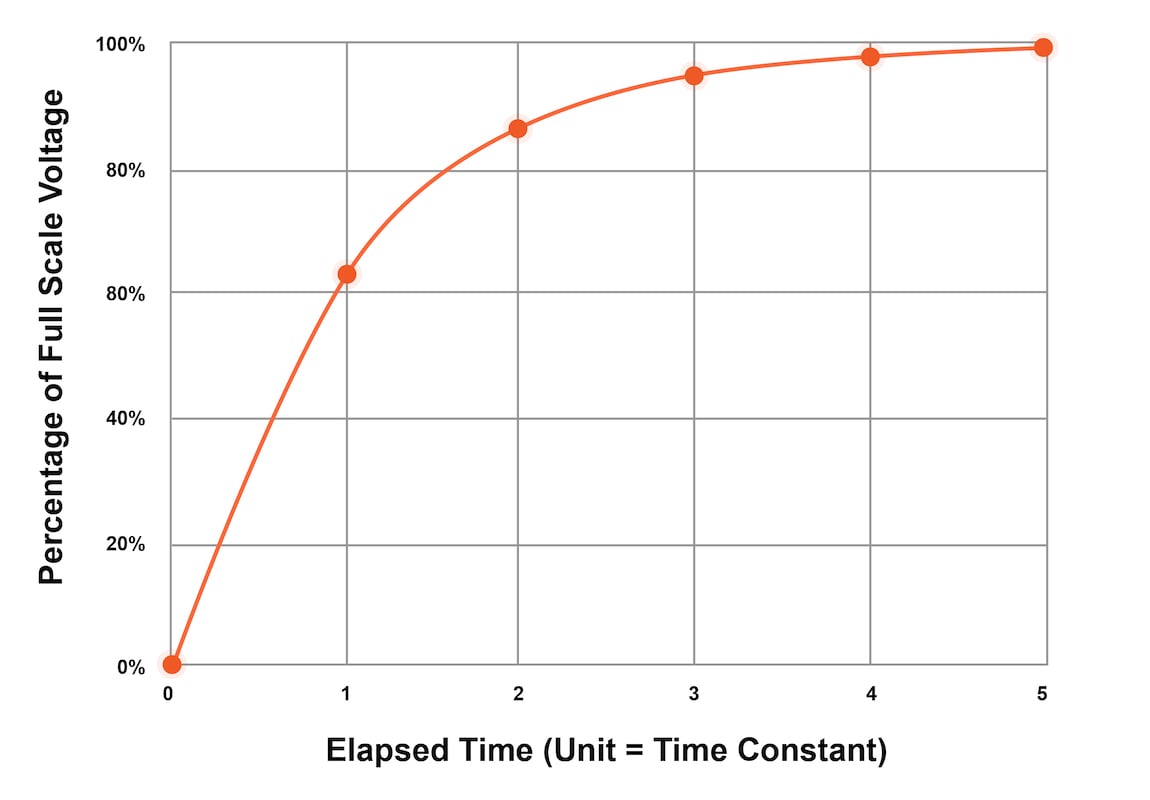
Figure 2. Capacitor voltage charging over time in a series RC network circuit
As a general guideline, three time constants (95%) are often considered charged. However, for high precision circuits like analog-to-digital converters (ADC) with many bits of resolution, the charging period must increase to eliminate this "settling time" charging error from affecting the accuracy.
Discharging Characteristics of a Series RC Circuit
Now let's consider what happens when we discharge a capacitor through a series resistor as in the circuit in Figure 3.
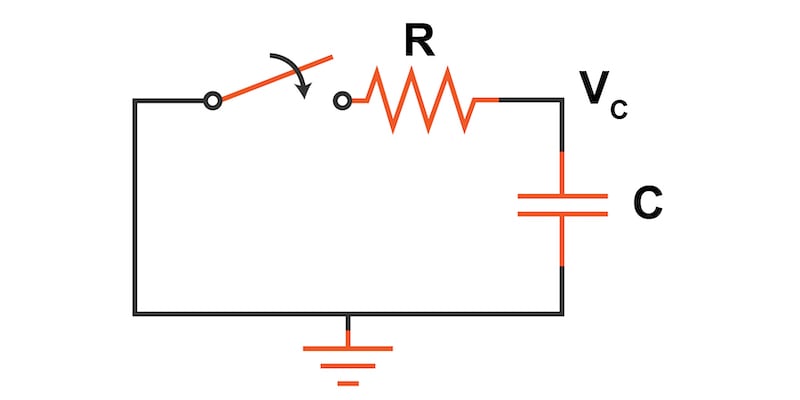
Figure 3. A series RC network discharging circuit
When discharging this series RC network, the time constant is the same, but the exponential discharge equation is given by:
$$V_C = V_{C0} · (e^{(\frac{-t}{\tau})})$$
Where:
$$V_{C0}$$ is the initial voltage of the capacitor at time = 0 before the switch is closed.
The following table provides the discharge percentages over time for the series RC circuit.
Table 2. Voltage discharging values for an RC series network.
| Ratio (t/RC) | 1 | 2 | 3 | 4 | 5 |
|---|---|---|---|---|---|
| Vc (% of $$V_{C0}$$) | 36.79 | 13.53 | 4.98 | 1.83 | 0.67 |
We can see how the capacitor voltage decreases with time in Figure 4.
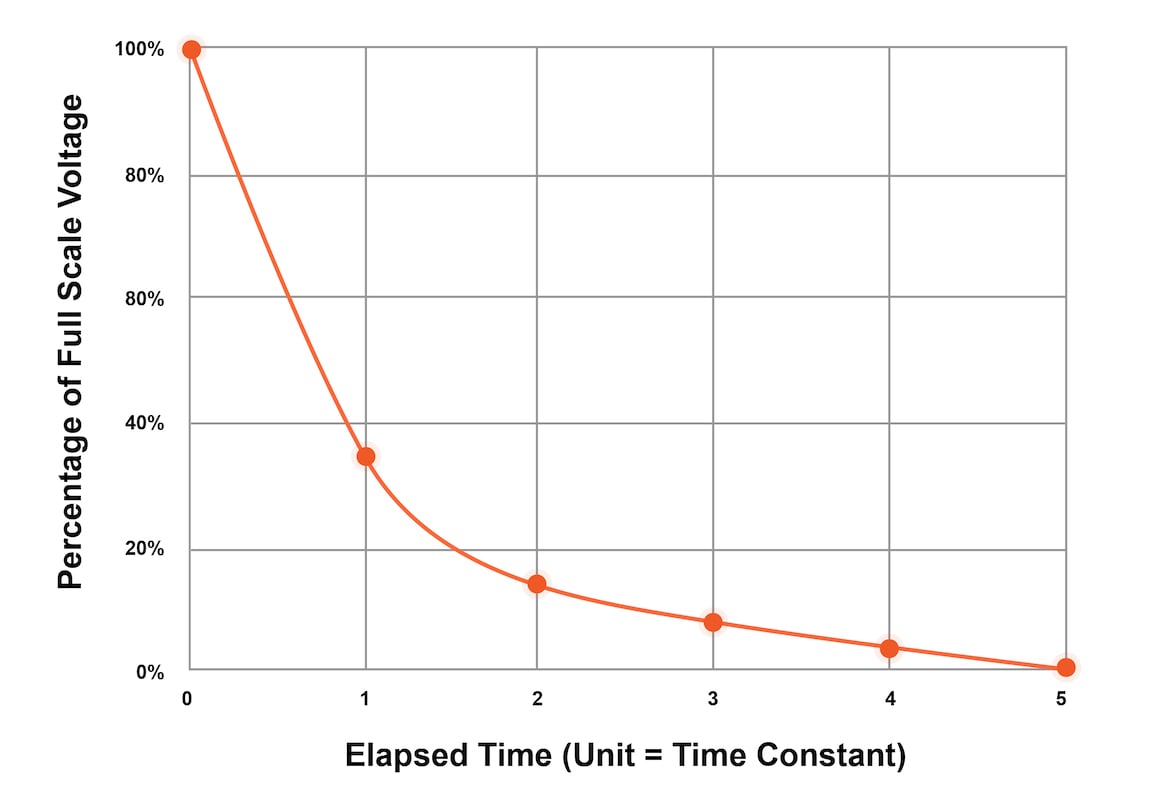
Figure 4. Capacitor voltage discharging over time in a series RC network circuit
Further Reading
Textbook—RC and L/R Time Constant: Complex Circuits
Textbook—RC and L/R Time Constant: Voltage and Current Calculations


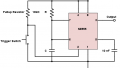
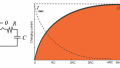
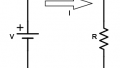
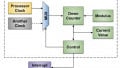


Figure 2 shows 80% twice. The one closest to the bottom on the vertical axis should be 60%.
Both graphs, FIgure 2 and Figure 4 have the 60% level marked as 80%.