Facebook
 Google
 GitHub
 Linkedin
Analog Integrated Circuits
Performance-Based Assessments for Analog Integrated Circuit Competencies
33 questions By Tony R. Kuphaldt
-
Question 4 of 33

Reveal answerUse circuit simulation software to verify your predicted and measured parameter values.
Notes:I recommend setting the function generator output for 1 volt, to make it easier for students to measure the point of “cutoff”. You may set it at some other value, though, if you so choose (or let students set the value themselves when they test the circuit!).
For resistors, I recommend students choose three (3) resistors of equal value if they wish to build the Sallen-Key circuit with a Butterworth response (where R2 = 1/2 R1). Resistor R1 will be a single resistor, while resistor R2 will be two resistors connected in parallel. This generally ensures a more precise 1:2 ratio than choosing individual components.
I also recommend having students use an oscilloscope to measure AC voltage in a circuit such as this, because some digital multimeters have difficulty accurately measuring AC voltage much beyond line frequency range. I find it particularly helpful to set the oscilloscope to the “X-Y” mode so that it draws a thin line on the screen rather than sweeps across the screen to show an actual waveform. This makes it easier to measure peak-to-peak voltage.
Values that have proven to work well for this exercise are given here, although of course many other values are possible:
- V = 12 volts
- -V = -12 volts
- R1 = 10 kΩ
- R2 = 5 kΩ (actually, two 10 kΩ resistors in parallel)
- Rcomp = 10 kΩ
- C1 = 0.002 μF (actually, two 0.001 μF capacitors in parallel)
- C2 = 0.002 μF (actually, two 0.001 μF capacitors in parallel)
- U1 = one-half of LM1458 dual operational amplifier
This combination of components gave a predicted cutoff frequency of 11.25 kHz, with an actual cutoff frequency (not factoring in component tolerances) of 11.11 kHz.
-
Question 5 of 33
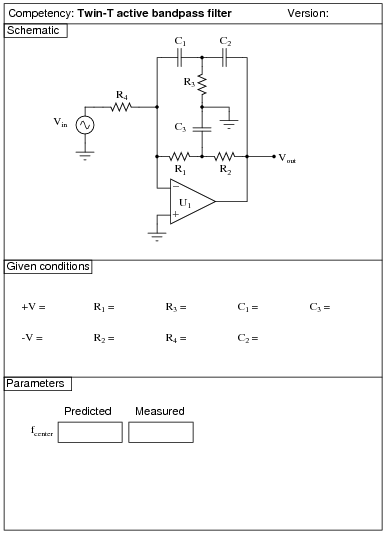
Reveal answerUse circuit simulation software to verify your predicted and measured parameter values.
Notes:I also recommend having students use an oscilloscope to measure AC voltage in a circuit such as this, because some digital multimeters have difficulty accurately measuring AC voltage much beyond line frequency range. I find it particularly helpful to set the oscilloscope to the “X-Y” mode so that it draws a thin line on the screen rather than sweeps across the screen to show an actual waveform. This makes it easier to measure peak-to-peak voltage.
Values that have proven to work well for this exercise are given here, although of course many other values are possible:
- V = 12 volts
- -V = -12 volts
- R1 = 10 kΩ
- R2 = 10 kΩ
- R3 = 5 kΩ (actually, two 10 kΩ resistors in parallel)
- R4 = 100 kΩ
- C1 = 0.001 μF
- C2 = 0.001 μF
- C3 = 0.002 μF (actually, two 0.001 μF capacitors in parallel)
- U1 = one-half of LM1458 dual operational amplifier
This combination of components gave a predicted center frequency of 15.92 kHz, with an actual cutoff frequency (not factoring in component tolerances) of 15.63 kHz.
-
Question 6 of 33

Reveal answerUse circuit simulation software to verify your predicted and measured parameter values.
Notes:Use a dual-voltage, regulated power supply to supply power to the opamp. Specify standard resistor values, all between 1 kΩ and 100 kΩ (1k5, 2k2, 2k7, 3k3, 4k7, 5k1, 6k8, 10k, 22k, 33k, 39k 47k, 68k, etc.).
I have had good success using the following values:
- V = 12 volts
- -V = -12 volts
- R1 = 10 kΩ
- R2 = 10 kΩ
- R3 = 10 kΩ
- C1 = 0.1 μF
- U1 = one-half of LM1458 dual operational amplifier
An extension of this exercise is to incorporate troubleshooting questions. Whether using this exercise as a performance assessment or simply as a concept-building lab, you might want to follow up your students’ results by asking them to predict the consequences of certain circuit faults.