Facebook
 Google
 GitHub
 Linkedin
Discrete Semiconductor Devices and Circuits
Rectifying Diodes
19 questions By Tony R. Kuphaldt
-
Question 1 of 19
Don’t just sit there! Build something!! Learning to mathematically analyze circuits requires much study and practice. Typically, students practice by working through lots of sample problems and checking their answers against those provided by the textbook or the instructor. While this is good, there is a much better way.
You will learn much more by actually building and analyzing real circuits, letting your test equipment provide the “answers” instead of a book or another person. For successful circuit-building exercises, follow these steps:
- Carefully measure and record all component values prior to circuit construction, choosing resistor values high enough to make damage to any active components unlikely.
- Draw the schematic diagram for the circuit to be analyzed.
- Carefully build this circuit on a breadboard or other convenient medium.
- Check the accuracy of the circuit’s construction, following each wire to each connection point, and verifying these elements one-by-one on the diagram.
- Mathematically analyze the circuit, solving for all voltage and current values.
- Carefully measure all voltages and currents, to verify the accuracy of your analysis.
- If there are any substantial errors (greater than a few percent), carefully check your circuit’s construction against the diagram, then carefully re-calculate the values and re-measure.
When students are first learning about semiconductor devices, and are most likely to damage them by making improper connections in their circuits, I recommend they experiment with large, high-wattage components (1N4001 rectifying diodes, TO-220 or TO-3 case power transistors, etc.), and using dry-cell battery power sources rather than a benchtop power supply. This decreases the likelihood of component damage.
As usual, avoid very high and very low resistor values, to avoid measurement errors caused by meter “loading” (on the high end) and to avoid transistor burnout (on the low end). I recommend resistors between 1 kΩ and 100 kΩ.
One way you can save time and reduce the possibility of error is to begin with a very simple circuit and incrementally add components to increase its complexity after each analysis, rather than building a whole new circuit for each practice problem. Another time-saving technique is to re-use the same components in a variety of different circuit configurations. This way, you won’t have to measure any component’s value more than once.
Reveal answerLet the electrons themselves give you the answers to your own “practice problems”!
Notes:It has been my experience that students require much practice with circuit analysis to become proficient. To this end, instructors usually provide their students with lots of practice problems to work through, and provide answers for students to check their work against. While this approach makes students proficient in circuit theory, it fails to fully educate them.
Students don’t just need mathematical practice. They also need real, hands-on practice building circuits and using test equipment. So, I suggest the following alternative approach: students should build their own “practice problems” with real components, and try to mathematically predict the various voltage and current values. This way, the mathematical theory “comes alive,” and students gain practical proficiency they wouldn’t gain merely by solving equations.
Another reason for following this method of practice is to teach students scientific method: the process of testing a hypothesis (in this case, mathematical predictions) by performing a real experiment. Students will also develop real troubleshooting skills as they occasionally make circuit construction errors.
Spend a few moments of time with your class to review some of the “rules” for building circuits before they begin. Discuss these issues with your students in the same Socratic manner you would normally discuss the worksheet questions, rather than simply telling them what they should and should not do. I never cease to be amazed at how poorly students grasp instructions when presented in a typical lecture (instructor monologue) format!
A note to those instructors who may complain about the “wasted” time required to have students build real circuits instead of just mathematically analyzing theoretical circuits:
What is the purpose of students taking your course?
If your students will be working with real circuits, then they should learn on real circuits whenever possible. If your goal is to educate theoretical physicists, then stick with abstract analysis, by all means! But most of us plan for our students to do something in the real world with the education we give them. The “wasted” time spent building real circuits will pay huge dividends when it comes time for them to apply their knowledge to practical problems.
Furthermore, having students build their own practice problems teaches them how to perform primary research, thus empowering them to continue their electrical/electronics education autonomously.
In most sciences, realistic experiments are much more difficult and expensive to set up than electrical circuits. Nuclear physics, biology, geology, and chemistry professors would just love to be able to have their students apply advanced mathematics to real experiments posing no safety hazard and costing less than a textbook. They can’t, but you can. Exploit the convenience inherent to your science, and get those students of yours practicing their math on lots of real circuits!
-
Question 2 of 19
When plotted on a curve tracer, the characteristic curve for a normal PN junction rectifying diode looks something like this:
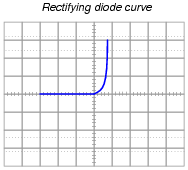
Label each axis (horizontal and vertical) of the curve tracer graph, then determine whether the diode behaves more like a voltage source or more like a current source (i.e. does it try to maintain constant voltage or does it try to maintain constant current?) when it is conducting current.
Models are very useful because they simplify circuit approximations. For example, we can analyze this diode circuit quite easily if we substitute an electrical source in place of the diode:
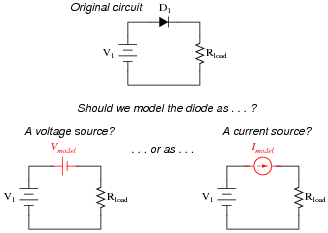
The only question here is, which substitution makes the most sense? Based on the diode’s characteristic curve behavior, should we substitute a voltage source or a current source in place of it? Assuming this is a 1N4001 rectifying diode, what is the value we should use for the substituting source?
Reveal answer
This behavior is similar to that of a voltage source once it is forward-biased and conducting current.
Follow-up question: quite obviously, diodes do not behave exactly as voltage sources. You cannot power anything off of a diode, for instance! Identify some of the limitations inherent to modeling diodes as voltage sources. Are there any instances you can think of where such a model could be misleading?
Notes:Modeling nonlinear semiconductor components in terms of linear, idealized passive components is a time-honored “trick” used to simplify circuit analysis. Like all “tricks” and analogies, this one has definite limitations. The follow-up question’s hint practically gives away examples of where such a model could be misleading!
-
Question 3 of 19
The following schematic diagram is of a simple curve tracer circuit, used to plot the current/voltage characteristics of different electronic components on an oscilloscope screen:

The way it works is by applying an AC voltage across the terminals of the device under test, outputting two different voltage signals to the oscilloscope. One signal, driving the horizontal axis of the oscilloscope, represents the voltage across the two terminals of the device. The other signal, driving the vertical axis of the oscilloscope, is the voltage dropped across the shunt resistor, representing current through the device. With the oscilloscope set for “X-Y” mode, the electron beam traces the device’s characteristic curve.
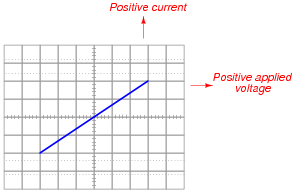
For example, a simple resistor would generate this oscilloscope display:
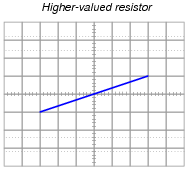
A resistor of greater value (more ohms of resistance) would generate a characteristic plot with a shallower slope, representing less current for the same amount of applied voltage:
Curve tracer circuits find their real value in testing semiconductor components, whose voltage/current behaviors are nonlinear. Take for instance this characteristic curve for an ordinary rectifying diode:
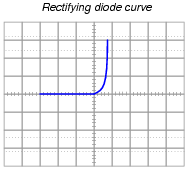
The trace is flat everywhere left of center where the applied voltage is negative, indicating no diode current when it is reverse-biased. To the right of center, though, the trace bends sharply upward, indicating exponential diode current with increasing applied voltage (forward-biased) just as the “diode equation” predicts.
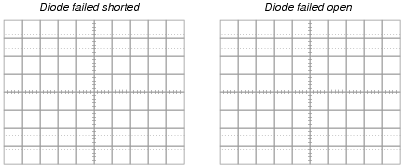
On the following grids, plot the characteristic curve for a diode that is failed shorted, and also for one that is failed open:
Reveal answer
Notes:Characteristic curves are not the easiest concept for some students to grasp, but they are incredibly informative. Not only can they illustrate the electrical behavior of a nonlinear device, but they can also be used to diagnose otherwise hard-to-measure faults. Letting students figure out what shorted and open curves look like is a good way to open their minds to this diagnostic tool, and to the nature of characteristic curves in general.
Although it is far from obvious, one of the oscilloscope channels will have to be “inverted” in order for the characteristic curve to appear in the correct quadrant(s) of the display. Most dual-trace oscilloscopes have a “channel invert” function that works well for this purpose. If engaging the channel invert function on the oscilloscope flips the wrong axis, you may reverse the connections of the test device to the curve tracer circuit, flipping both axes simultaneously. Between reversing device connections and reversing one channel of the oscilloscope, you can get the curve to plot any way you want it to!