Facebook
 Google
 GitHub
 Linkedin
Analyzing the Noise Performance of Coherent SSB Demodulators
Using a graphical approach, we show that coherent SSB demodulation leaves the input and output SNR unchanged, then compare its noise performance to DSB-SC and baseband systems.
In the earlier parts of this series, we examined the noise performance of the coherent DSB‑SC demodulator. This article extends our exploration of noise in communication systems by focusing on the single-sideband amplitude modulation (SSB) scheme, which also relies on coherent (or synchronous) detection techniques.
To make the analysis more intuitive, we adopt a graphical approach to illustrate how the input and output SNR are related under this method. After looking at the SSB SNR, we’ll learn how the baseband communication system can be used as a reference point for comparing the SNRs of different demodulation methods. Using the baseband benchmark, we’ll then compare the noise performance of DSB‑SC and SSB demodulators.
Brief Overview of the SSB Method
The SSB signal can be expressed as:
$$s(t) = A_c m(t) cos(\omega_c t) \mp A_cm_h(t) sin(\omega_c t)$$
Equation 1
where Ac is the carrier amplitude, m(t) is the message signal, and mh(t) is the Hilbert transform of the message. The plus sign in the above equation produces the lower sidebands, whereas the minus sign retains the upper sidebands at the output. As shown in Figure 1, the message is often a lowpass signal of bandwidth W, implying that virtually no power is present at frequencies above W.
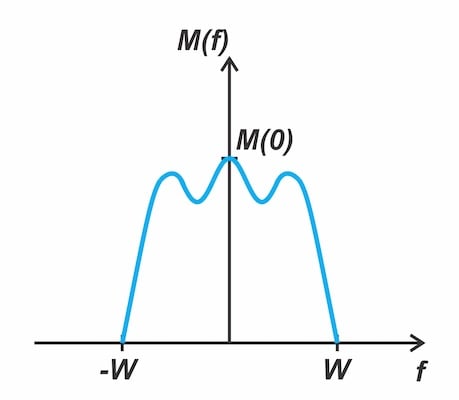
Figure 1.The spectrum of the message signal has zero power for |f|>W.
The SSB signal, with the upper sideband in use, has the typical spectrum illustrated in Figure 2.
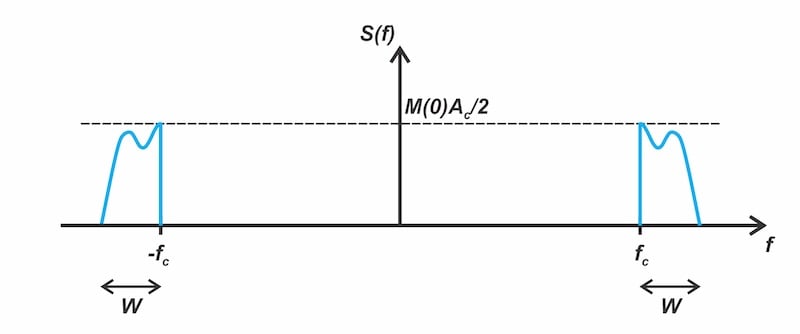
Figure 2. Typical spectrum of an SSB signal.
To demodulate SSB (and DSB-SC) waves, we can use the coherent detector shown in Figure 3.
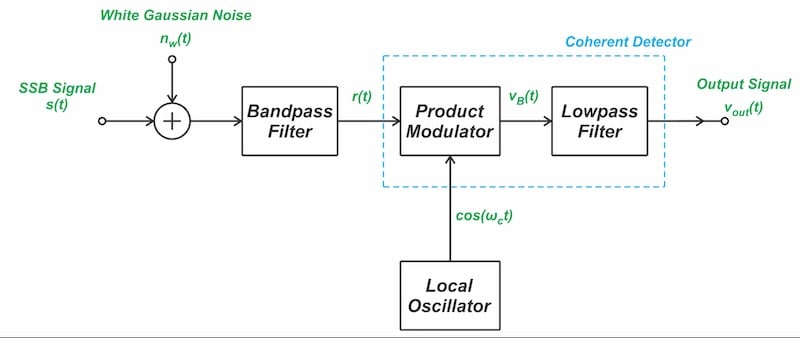
Figure 3. Basic block diagram of the coherent SSB demodulator.
We now turn to examining how coherent detection influences the input noise and the SSB signal.
Calculation of Output Signal Power
The foundation of the noise analysis in this article lies in recognizing how multiplication by cos(2πfct) during demodulation transforms the signal spectrum. When a spectral component at frequency f1 is multiplied by cos(2πfct), it produces two new components at f1±fc. Each of these components has half the amplitude of the original and therefore one‑fourth of its power.
Multiplying the positive-frequency portion of s(t) by cos(2πfct) produces two shifted spectral components: one component appears at baseband and another at twice the carrier frequency 2fc, as shown in Figure 4.
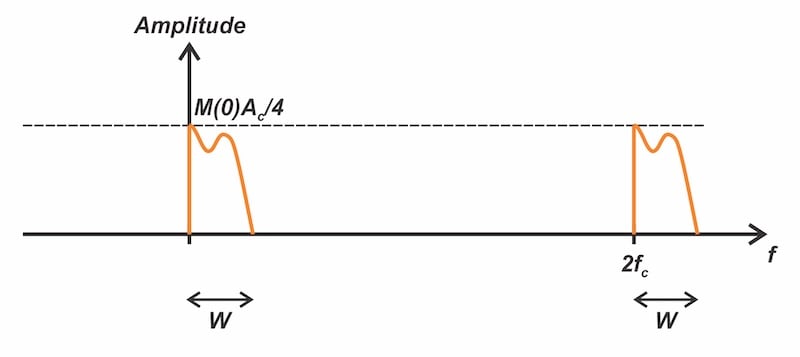
Figure 4. Spectrum resulting from multiplying the positive-frequency portion of s(t) by the carrier wave.
Note that the amplitude of each frequency component is scaled by a factor of 0.5. Likewise, the negative‑frequency portion generates two components, one at −2fc and the other at baseband, as shown in Figure 5.
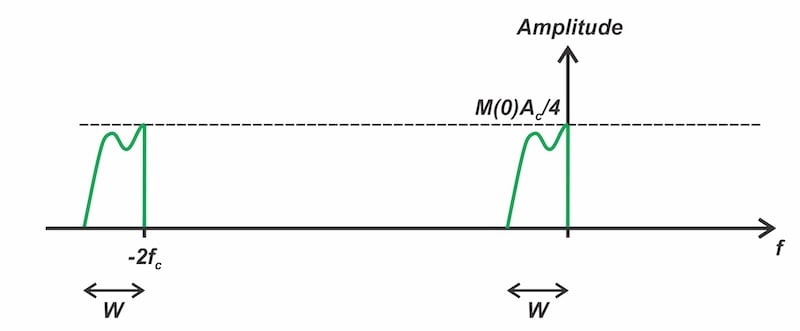
Figure 5. Spectrum resulting from multiplying the negative-frequency portion of s(t) by the carrier wave.
The double-frequency components are removed by the lowpass filter following the multiplier. This leads to the output spectrum shown in Figure 6.
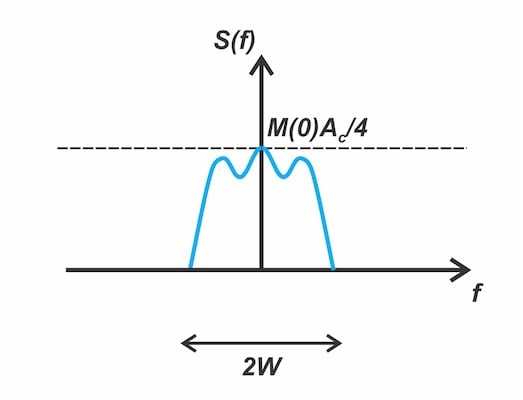
Figure 6. The output signal spectrum when using the SSB method.
The baseband contributions from the positive and negative sides stay separate, and each is scaled by a factor of 0.5 relative to the input SSB sidebands. Comparing the spectra in Figures 2 and 6, we note that they differ only by a frequency shift and an amplitude scaling factor of 0.5. If we denote the input and output signal powers by Ps,in and Ps,out, then:
$$P_{s,out} = \frac{1}{4} P_{s,in}$$
Equation 2
Calculation of Output Noise Power
For the output noise evaluation, we note that when the upper sideband is selected, the carrier filter bandwidth extends from fc to fc+W. Consequently, the noise at the bandpass filter output exhibits the spectrum shown in Figure 7.
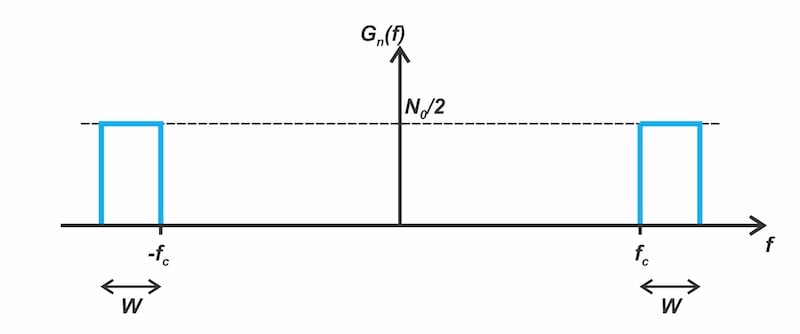
Figure 7. The noise PSD at the output of the carrier filter.
The noise undergoes a transformation analogous to that of the signal, yielding the output spectrum shown in Figure 8.
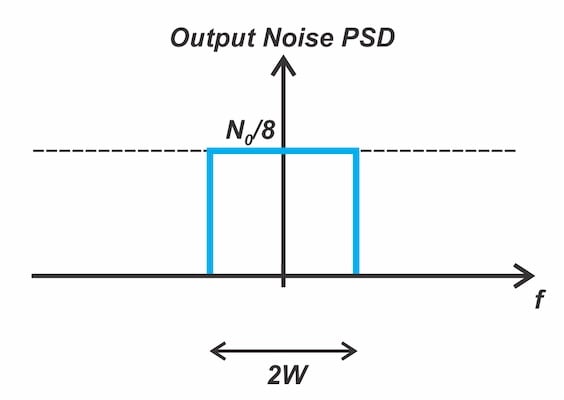
Figure 8. The noise PSD at the output of the lowpass filter.
Remember that the PSD expresses power. This means each frequency component is scaled by 0.25, not by 0.5 as in the earlier discussion of signal transformation. The areas under the PSD curves in Figures 7 and 8, respectively, give the input and output noise power as Pn,in=N0W and Pn,out=N0W/4. Therefore, we have:
$$P_{n,out} = \frac{1}{4} P_{n,in}$$
Equation 3
SSB SNR Performance Under Coherent Detection
Using Equations 2 and 3, both signal and noise powers are scaled by the same factor. The input and output SNR remain equal in the coherent SSB demodulation:
$$SNR_{out} = \frac{P_{s,out}}{P_{n,out}} = \frac{\frac{1}{4} P_{s,in}}{\frac{1}{4} P_{n,in}} = SNR_{in}$$
Equation 4
The process of SSB detection is essentially a frequency translation in which all signal and noise components are shifted, without modification, to low frequencies. This frequency translation impacts signal and noise in the same way, leaving the SNR unaffected.
In practice, mixers and filters introduce losses and add noise, which degrades the output SNR. However, the process of SSB demodulation itself doesn’t degrade the SNR.
Noise Performance Comparison: DSB‑SC vs. SSB
In the previous article, we noted that DSB‑SC demodulation doubles the SNR. Therefore, for DSB-SC, we have:
$$SNR_{out} = 2 \ SNR_{in}$$
Equation 5
Equation 4, however, indicates that the SSB demodulator’s output SNR equals its input SNR. This comparison may suggest that DSB‑SC offers superior noise performance relative to SSB. Closer analysis shows this is not the case.
A clearer comparison is obtained by accounting for the input noise power. In DSB-SC transmission, the carrier filter must have a minimum bandwidth equal to twice the message bandwidth, 2W. Therefore, the input noise for the DSB-SC case is 2N0W. Substituting this into the DSB-SC SNR equation (Equation 5), we have:
$$SNR_{out} = \frac{2 P_{s,in}}{ P_{n,in}} = \frac{2 P_{s,in}}{ 2N_O W} = \frac{P_{s,in}}{N_O W}$$
Equation 6
For the SSB-SC system, the input noise is Pn,in=N0W, as shown in Figure 7. Substituting Pn,in into the corresponding SNR expression (Equation 4), we obtain:
$$SNR_{out} = \frac{P_{s,in}}{ P_{n,in}} = \frac{P_{s,in}}{N_O W}$$
Equation 7
which is the same as the SNR expression for the DSB-SC system. It follows that both DSB‑SC and SSB methods achieve the same noise performance under equal input power, bandwidth, and channel noise conditions. Although DSB‑SC demodulation doubles the SNR, it is subject to twice the input noise power compared to the SSB method.
Baseband System as a Standard for Evaluating Other Architectures
DSB‑SC and SSB schemes yield equivalent noise performance when operating under the same conditions. This result, however, doesn’t hold for other communication systems, such as AM systems with envelope detection or FM systems. In general, the output SNR depends on the modulation used in the transmitter and the demodulation method used in the receiver.
To enable meaningful comparisons across different methods, the demodulator’s output SNR is typically benchmarked against that of an equivalent baseband system. The baseband system operates without any form of modulation or demodulation. Figure 9 illustrates the basic receiver model employed in a baseband communication system.
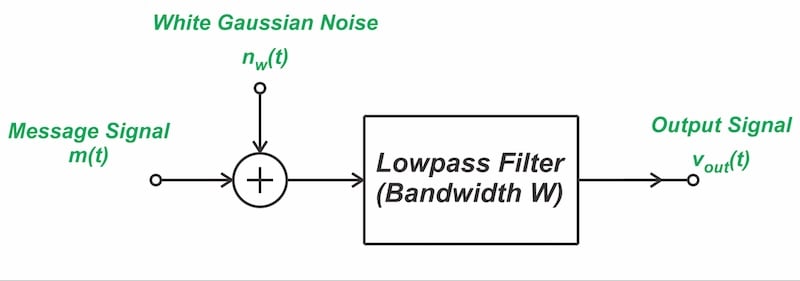
Figure 9. Block diagram of the baseband receiver.
The receiver consists of an ideal low‑pass filter with bandwidth W, equal to the message bandwidth, to minimize out‑of‑band noise. Figure 10 illustrates the function of the low‑pass filter by showing the signal and noise spectra at the receiver's input and output.
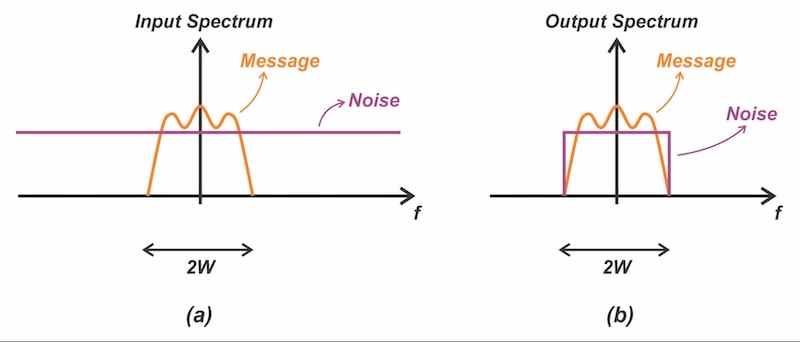
Figure 10. Signal and noise spectra at the input (a) and output (b) of the low‑pass filter.
If the noise has a double-sided PSD of N0/2, then the noise power at the output of the receiver is N0W. If we denote the received power by Ps,in, the SNR at the output of the baseband system is:
$$SNR_{Baseband} = \frac{P_{s,in}}{N_O W}$$
Equation 8
By establishing the baseband SNR, we create a meaningful standard for comparing the SNR performance of various demodulation systems.
Example: Determining SNR of a Baseband Communication System
Suppose a transmitter radiates 500 W of power. The communication channel attenuates by a factor of 10−11, the message bandwidth is 10 kHz, and the noise spectral density is N0=2×10⁻¹⁴ W/Hz. Determine the output SNR of the baseband communication system.
Solution:
Because the channel attenuates by 10−11, the received power is obtained by multiplying the transmitted 500 W by 10−11, which gives Ps,in=5×10⁻⁹ W. Plugging the problem data into Equation 8 gives:
$$SNR_{Baseband} = \frac{5 \times 10^{-9}}{2 \times 10^{-14} \times 10 \times 10^3} = 25$$
Equation 9
Expressed in decibels, the SNR of 25 translates to 10log(25) ≈ 14 dB.
Comparing DSB-SC and SSB with Baseband Communication
By comparing the SNR expressions derived for the DSB‑SC and SSB methods (Equations 6 and 7) with that of the baseband system (Equation 8), we observe that all of them have identical output SNRs. In other words, DSB‑SC and SSB schemes don’t yield any SNR improvement relative to baseband communication.
The same result is reached by explicitly calculating the output SNR, a method found in most references. For example, in the case of the DSB-SC modulation, we know that the modulated signal is given by:
$$s(t) = m(t) \times A_c cos(\omega_c t)$$
Equation 10
which is achieved by directly multiplying the message signal m(t) by the carrier wave Ac cos(ωct). If you followed the derivation in the previous article, you should now be able to readily compute the average power of the received signal as:
$$P_{s, in} = \frac{1}{2}A_c^2 \times P_m$$
Equation 11
where Pm is the average power of the message signal. Furthermore, we derived the following expression for the output SNR of a DSB‑SC system:
$$SNR_{out} = \frac{ A_c^2 \times P_m}{2N_0 W}$$
Equation 12
Combining Equations 11 and 12, the output SNR may be rewritten in terms of the received power Ps,in as:
$$SNR_{out} = \frac{P_{s,in}}{N_O W}$$
Equation 13
As seen, the output SNR is the same as that of the baseband system (Equation 8).
Channel Signal‑to‑Noise Ratio: An Alternative Term for Baseband SNR
In evaluating the noise performance of different demodulation methods, it’s essential to establish a frame of reference to ensure fair and meaningful comparisons. The output SNR of the equivalent baseband system discussed earlier serves as a common benchmark. For completeness, we note that some references adopt the channel signal‑to‑noise ratio as the basis for comparison; however, this measure equals the baseband SNR, differing only in terminology.
The channel SNR is defined as the ratio of the average power of the received modulated signal Ps,in to the average power of the channel noise in the message bandwidth W, both measured at the receiver input. If the noise has a double-sided PSD of N0/2, what would be the noise power in the message bandwidth? When using the concept of channel SNR, the noise power in the message bandwidth is taken to be N0W. Hence, the channel SNR is given by:
$$SNR_{c} = \frac{P_{s,in}}{N_O W}$$
Equation 14
This is the same as the output SNR of the equivalent baseband system shown in Equation 8. At first glance, it may seem confusing that channel SNR is defined at the input and baseband SNR at the output, but they are essentially the same reference. By dividing the output SNR of a demodulation method by the channel SNR, we obtain a figure of merit for the demodulator’s noise performance:
$$Figure \ of \ Merit = \frac{SNR_{out}}{SNR_{c}}$$
Equation 15
Clearly, a higher figure of merit corresponds to better noise performance. In practice, this figure may equal one (as in DSB‑SC and SSB systems), fall below one, or exceed one.
What Is Carrier-to-Noise Ratio?
In examining the noise performance of demodulation methods, another power ratio that sometimes appears, and can cause confusion, is the carrier‑to‑noise ratio (CNR). Although this parameter won’t be used in this article, it’s introduced here to highlight its distinction from the channel SNR. The CNR is typically defined as the power of the unmodulated carrier (Ac2/2) to the noise power present at the input of the demodulator, after the bandpass filter. The passband of the bandpass filter is determined by the modulated signal’s transmission bandwidth BT. The total noise power after bandpass filtering is 2(N0/2)BT=N0BT, which leads to the following expression for CNR:
$$CNR = \frac{A_c^2}{2N_O B_T}$$
Equation 16
While the channel SNR provides a common frame of reference, the CNR varies with the modulation method because of the BT term in its expression. By way of example, the transmission bandwidth in double-sideband AM methods is twice the message bandwidth BT=2W, producing:
$$CNR = \frac{A_c^2}{4N_O W}$$
Equation 17
In FM systems, the transmission bandwidth can exceed the message bandwidth by a factor set by the modulation index β. The appropriate transmission bandwidth must then be used in the CNR expression.
Final Thoughts
In this article, we used a graphical approach to examine the output SNR of the coherent SSB detector and compared it with the SNR of the DSB‑SC scheme. We emphasized that the baseband communication system serves as the standard of comparison when assessing the noise performance of different demodulation techniques. We also observed that DSB‑SC and SSB schemes don’t yield any SNR improvement relative to the baseband communication. In these cases, the sole effect of modulation is to translate the message signal into another frequency band, enabling its transmission through a bandpass channel.
Related Content