 Facebook
 Google
 GitHub
 Linkedin
How Do Time of Flight Sensors (ToF) Work? A Look at ToF 3D Cameras
How do time of flight sensors determine distances? Learn more about ToF cameras using an example 3D camera.
How do time of flight sensors determine distances? Learn more about ToF cameras using an example 3D camera.
There are three leading 3D imaging technologies competing for space in your cellphone and your automobile. Those technologies are stereoscopic imaging, structured light projection, and time-of-flight (or ToF) cameras. The data these devices generate can provide pedestrian detection, authenticate users based on facial features, detect hand movement, and feed SLAM (simultaneous localization and mapping) algorithms.
Two of the largest players in this space are ams and Infineon. At the time of writing, ams carries one of each type of sensor and Infineon focuses on time-of-flight sensors only.

This article describes the technology behind time-of-flight sensors by focusing on a 3D camera development kit “pico flexx” from pmdtechnologies. (Before you ask, both "pico flexx" and "pmdtechnologies" are presented as all lower-case on their website.).
The pico flexx is built around the jointly developed 3D image sensor REAL3 from Infineon and pmd.

False-color 3D image of a hand taken from pmdtec.com on April 29, 2019. Colors are mapped to individual pixels based on distance from the sensor to the hand (red is near, blue is far)
Please note that pmd provided a device to us for this article.
What Is a Time of Flight Sensor?
Time of flight sensors measure the time it takes something to travel a distance through a medium. Typically, this is the measurement of the time elapsed between the emission of a wave pulse, its reflection off of an object, and its return to the ToF sensor. A time of flight camera is a device that utilizes ToF measurement to determine distances between the camera and objects or environments, creating images generated by individually-measured points.
Applications of ToF cameras include laser-based scanner-less LiDAR imaging systems, motion sensing and tracking, object detection for machine vision and autonomous driving, topographic mapping, and more.
But how are these measurements achieved?
Below, I've represented three ways to use travel-time to determine distance.

Methods of using travel time to determine distances
At the top of the image, you can see the first method, which is to send pulses and measure the time interval until they return after reflection.
The middle of the image shows the second method, wherein you may modulate the amplitude of a light source and record the phase shift of the reflected wave.
The bottom of the image represents the third method, transmitting a 50% duty cycle square-wave and record the amount of returned light that arrives in a specific interval.
Millimeter-Level Precision ToF Cameras
Light and radio waves travel at nearly 300,000,000,000 mm/s, which translates to ~3.3 ps for a wave to travel 1 mm (and another 3.3 ps to return). That means, if you want a device that can image all the objects in the room you are in and you want ~ 1 mm resolution, your timing electronics would need picosecond resolution. That translates to a clock speed of hundreds of GHz.
It is neither easy nor economical to design electronic circuits that operate at those frequencies, so designers had to come up with a way to work at lower frequencies if they hoped to bring the devices affordable to the consumer space.
Two common methods exist to achieve millimeter-level precision while working with reasonable, sub-GHz frequencies:
- Relating the phase shift of a sinusoidally modulated wave to distance
- Using the phase-shift of a 50% duty-cycle square wave and a differential voltage to determine distance
In the sections below, we'll look at these two methods in greater detail.
Determining Distance by Phase Shift of an Amplitude Modulated Wave
Let's say you're looking to map out a small office or large living room with a maximum length dimension of 15 m. To determine an appropriate operating frequency for that length, use $$c=\lambda \cdot f$$ where c is the speed of light (c=3x10⁸ m/s), λ is one wavelength (λ=15 m), and ƒ is the frequency. In this example, ƒ=20 MHz, which is a relatively easy frequency to work with.
It all begins when a bright light has its output modulated with a 20 MHz sinusoidal signal. The light wave will eventually reach an object or the wall and it will reflect and reverse directions. A dimmer version of the original modulated light will return to the receiver. Unless the object is exactly an integer multiple of 15 meters away, the phase will be shifted by some amount.
The phase shift can be used to calculate the distance the wave traveled.

If you can accurately measure the phase angle, you can accurately determine the distance the reflecting object is away from the sensor/receiver.
How to Measure the Phase Angle of a Sinusoid
So, how do you quickly measure the phase angle of a sinusoid? That involves measuring the amplitude of the received signal at four equally spaced points (i.e., a separation of 90° or 1/4 λ).
$$\varphi=ArcTan \left ( \frac{A_1-A_3}{A_2-A_4} \right )$$
I have attempted to illustrate the relationship between the measurements and the phase angle below. The ratio of the difference between A1 and A3 and the difference between A2 and A4 is equal to the tangent of the phase angle. ArcTan is actually the two-argument arc-tangent function which maps appropriate quadrants and defines when A2=A4 and A1>A3 or A3>A1 as 0° or 180°, respectively.
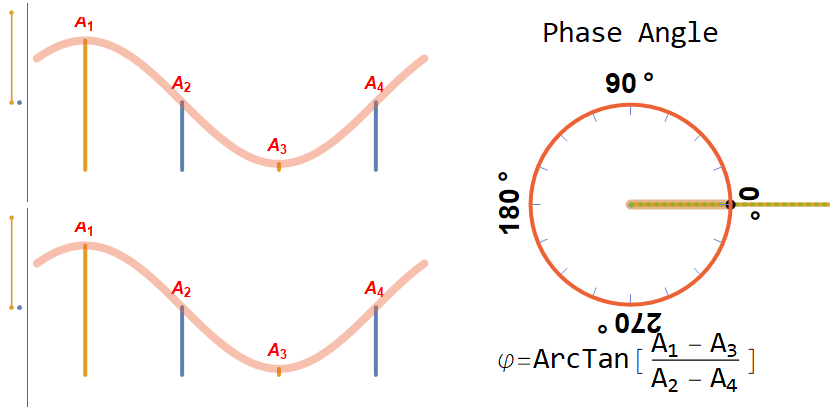
Click on the diagram to see a more complicated image that illustrates how the differences of the variables A1, A2, A3, and A4 fit on the unit circle.
In the illustration above, the far left of the graph has two vertical number lines that show the result of subtracting A1 and A3 (represented as dark yellow) and A2 and A4 (represented as blue). The measured values are shown as vertical lines in the sinusoid graphs in the middle.
Note that this graphic does not take reflection into account (which would effectively shift everything 180°).
Determining Operating Frequency for a Given Distance
Back to our example, the distance to the target is determined with the equation:
$$d=\frac{c \cdot \varphi}{4 \pi \cdot f}$$
Where c is the speed of light, phi (φ) is the phase angle (in radians), and ƒ is the modulation frequency.
Measuring the actual time-of-flight of a photon requires 333 GHz electronics. This method requires a maximum of 4x the modulation frequency, which in this case is 4x20 MHz=80 MHz. This is a phenomenal reduction in resources. But you’ll be happy to know that some clever engineers found a way to reduce the maximum frequency even further.
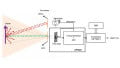
Determining Phase Shift through Differential Voltage Measurement of Charged Capacitors
The next measurement situation involves a stroboscopic light source and a CMOS imaging sensor with two capacitors per pixel.
A clock source generates a 50% duty cycle square wave and that square wave controls a bright strobing light source, as well as the connection to the charge-storage capacitors inside each pixel.
An example of such a system is represented in the image below:

Image from “A Fast Calibration Method for Photonic Mixer Device Solid-State Array LiDARS” This shows a CMOS pixel with two charge storage capacitors that are alternately connected to record incoming light.
Light leaves the source, reflects off an object, and strikes the pixel where it will be recorded as a charge in capacitor CA or CB shown above. The capacitors are alternately connected to the pixel at the same frequency as the illumination source, using the same clock source.
This clever arrangement means that the differential charge in the capacitors relates directly to the phase offset. And the phase is determined by the wavelength and the distance to the target and back.

Image from “A Fast Calibration Method for Photonic Mixer Device Solid-State Array LiDARS”
The subject can be illuminated for as many cycles as needed to fill the capacitors. As long as the distance is constant, the charge proportions will stay the same
Time of Flight Sensors in Action
How well does this method work? Better than you might expect.
The sensor provided to AAC, combined with the accompanying software, has the ability to record up to 45 fps. At lower refresh rates the system can easily image wrinkles on a shirt.

The above image plots the (x,y,z) vertex location of each captured pixel from pmd’s pico flexx camera.
Depth-only data is difficult to visualize by itself. So the depth image is often combined with a photograph, or shown using false coloring to allow easier visualization of the scene.

A false-color depth overlay of a low-resolution image makes it easier to interpret the scene. Image of the goober author captured with pmd's Royal Viewer software and the CamBoard pico flexx 3D development kit.
Time of flight sensors can be utilized in a range of applications, including creating a 3D map of the environment when combining clever physics with engineering.
Have you ever used 3D cameras in your work? What can you tell us about the design constraints of using time of flight sensors? Share your experiences in the comments below.
Related Content


Dear Mark,
First of all thanks for this article, which I was looking for last couple of days. Its clearly explain the principle behind the ToF camera and compare different techniques. I am new in this area, however, interested to continue this technology for LiDAR application. I have a very basic question relate with this ToF technique.
If i have a conventional CCD/CMOS camera sensor (not like that of ToF sensor in PMD) and working frequency in MHz range for pulsed laser, can you please suggest a good technique/guideline to form a depth image?
Hello @pallab choudhury,
I would suspect that the amplitude-modulated phase determination would be the best way to go about it in your setup. But without knowing your situation, it’s difficult to say more.
Essentially, you’d put your laser, your camera, and your object in a darkened room. Then modulate the intensity of the laser at frequency f as it illuminated the object (the greater the modulation amplitude the better). Your camera would record a minimum of four photographs with time interval chosen to coincide with the modulation frequency (4/t=f). Then you’d use software to calculate the phase shift for each pixel from the four photographs, and use that to determine your distance.
There are a great many implementation obstacles to overcome—I figure the first is to ensure that the reflected light is within the dynamic range of your CCD during your capture period. Carefully controlling the capture, etc…..
Good luck!
Hi Mark,
thanks for this great article as well from my side.
I wonder whether the differential approach does need the low frequency modulation as well? You don’t mention it, however I would guess otherwise my uniqueness-distance would be very small?
So I assume, using this one multiplies the strobe light with two functions, the square function (on off) as well as an amplitude modulation (to get in the low freq. range). In your example, the low frequency is 20 MHz. Does this mean the PMD detector needs “only” 20 MHz vs. 80 MHz that a AM modulation sensor would need?
Thanks,
Max.