Facebook
 Google
 GitHub
 Linkedin
AC Electric Circuits
AC phase
24 questions By Tony R. Kuphaldt
-
Question 1 of 24
If we were to express the series-connected DC voltages as phasors (arrows pointing with a particular length and a particular direction, graphically expressing magnitude and polarity of an electrical signal), how would we draw them in such a way that the total (or resultant) phasors accurately expressed the total voltage of each series-connected pair?
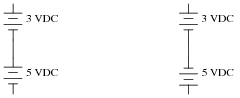
If we were to assign angle values to each of these phasors, what would you suggest?
Reveal answer
In the right-hand circuit, where the two voltage sources are opposing, one of the phasors will have an angle of 0o, while the other will have an angle of 180o.
Notes:Phasors are really nothing more than an extension of the familiar “number line” most students see during their primary education years. The important difference here is that phasors are two-dimensional magnitudes, not one-dimensional, as scalar numbers are.
The use of degrees to measure angles should be familiar as well, even to those students without a strong mathematics background. For example, what does it mean when a skateboarder or stunt bicyclist “does a 180”? It means they turn around so as to face the opposite direction (180 degrees away from) their previous direction.
-
Question 2 of 24
Calculate the total voltage of these series-connected voltage sources:

Reveal answerThis is a “trick” question, because only the total voltage of the DC sources may be predicted with certainty. There is insufficient information to calculate the total AC voltage for the two series-connected AC sources!

Notes:Discuss with your students exactly why the total voltage of the two series-connected AC sources cannot be determined, given the little information we have about them. Is it possible for their total voltage to be 8 VAC, just like the series-aiding DC sources? Is it possible for their total voltage to be 2 VAC, just like the series-opposing DC sources? Why or why not?
-
Question 3 of 24
Using a computer or graphing calculator, plot the sum of these two sine waves:
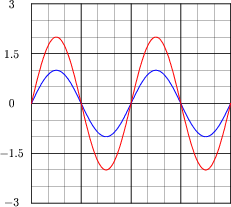
What do you suppose the sum of a 1-volt (peak) sine wave and a 2-volt (peak) sine wave will be, if both waves are perfectly in-phase with each other?
Hint: you will need to enter equations into your plotting device that look something like this:
y1 = sin x
y2 = 2 * sin x
y3 = y1 y2
Reveal answer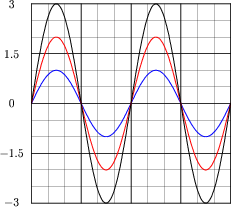
Notes:Graphing calculators are excellent tools to use for learning experiences such as this. In far less time than it would take to plot a third sine wave by hand, students may see the sinusoidal sum for themselves.