 Facebook
 Google
 GitHub
 Linkedin
Using a SIM900A to Send Sensor Data to a Website
In this article, I'll show you how I used one of my SIM900A GSM modules to send temperature and relative humidity to my personal website.
In this article, I'll show you how I used one of my SIM900A GSM modules to send temperature and relative humidity to my personal website.
I want to be able to monitor the temperature and humidity onboard my boat and to see the data on my web page. Unfortunately, there isn't a Wi-Fi signal at the marina where my boat is kept. This is where the SIM900A GSM module comes in handy. The SIM900A GSM module is able to send SMS messages and connect to the internet and send data. In my case, it's sending temperature and humidity data.
I'd like the data to be presented in one diagram with two bar graphs. I searched the web for some free libraries that could give me the graphs I wanted. The one I settled on was this one: PHPGraphLib by Elliott Brueggeman. It's a lightweight open source PHP-based graphing library.

The most recent nine readings; the tenth on the far right is the startup data.
Required Items
To complete this project, you'll need the following:
- SIM900A GSM module with a working SIM card (eBay listing, SimCom modem product page)
- Computer with MPLAB X IDE and XC8 compiler installed (in my case, I'm using MPLAB X v3.50, XC8 v1.40)
- Access to a website where you can add files and a MySQL database
- PIC16F690
- 16×2 LCD
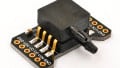
- DHT11 sensor (I bought mine from eBay)
- Breadboard and jumper wires
- Parts listed in the BOM (see below)
- Optional: USB-to-TTL converter and gtkTerm or similar serial program for debugging
The BOM
This is the complete BOM from BOM.ulp in EagleCAD.

I kept the "Device" and "Package" columns for the benefit of EagleCAD users.
Hardware
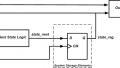
A good way to structure your work and projects is to make a block diagram of what you want. Here you can see my block diagram for this device:

My block diagram
I want a PIC to read data from a DHT11 sensor and send the data to a web page, and I also want to display the data on an LCD. To program the PIC, I'm using my PICkit 3.5 programmer.
Flowcharts are also extremely helpful. This is what I made for the software:

Flowchart for my PIC firmware
First, power is applied and the microcontroller goes through some configuration and initialization functions.
Then a welcome message is displayed and the microcontroller starts to count down. The countdown is included in the program so I can see that it's working, and not stalled while it's waiting for the GSM module to register on the cell phone network.
After the countdown has finished, I ask for the operator name, which is displayed on the LCD. The program then tells the module to open GPRS and connect to the GPRS network. Now the module's IP address is displayed on the LCD and the gsm_send_data function is called. This sends the data from the sensor.
The first time the function is called, the sensor has not been read, so the values are t (temperature) = 00 and h (humidity) = 00. I want the sensor to be fully acclimated before sending data. After that, the LCD is cleared, and the program enters two loops, one inside the other. The inner loop reads the DHT sensor and updates the LCD with sensor data and a countdown timer, showing minutes and seconds left until the next data transmission.
When the countdown is finished, the data is sent and the outer loop sends the program back to reading the DHT11 and updating the LCD.
Schematics
We'll start with the power supply. I'm using a linear voltage regulator. If you need better efficiency, you can use a switching regulator instead.
Here is the power-supply portion of my circuit:

I like to use some extra capacitors on both the input and the output of the regulator. According to the datasheet, this is not necessary, but I've experienced a more stable output this way.

This is a prototype, so I've connected the PIC's unused pins to test points. By doing that, I can modify functionality or add features without major inconvenience (such as etching a new PCB). For example, we could use the microcontroller's integrated ADC to measure the battery voltage and send that to the web page as well.

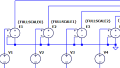
(Left) In Circuit Serial Programming block; (Right) Oscillator block. I'm running the PIC at 8MHz.

(Left) This is how the DHT11 sensor is connected. C8 is soldered directly to the module's power pins, as it should be as close to the module as possible. (Right) Instead of turning the PIC on and off, I've added a two-pin connector; these connections will allow me to use a normally-open pushbutton for resetting the PIC.

(Left) The 16×2 LCD; (Right) Connections for the SIM900A module.
Click here for a high-resolution image of the schematic.
Here are some photos of my assembly:

This is the breadboarded version of the circuit.

The complete project.

I used the toner transfer method to get the board layout onto the PCB.
The Code in the PIC
The flowchart in the "Hardware" section above gives me the structure my program needs. To send commands to the GSM module, I'm using the PIC's UART in conjunction with the printf() function. During programming and debugging, I can use printf() to display information on a screen. This helped me with the development. My breadboarded circuit is connected to a computer running gtkTerm.
The module detects the baud rate automatically; I used a 9600-n-8-1 UART configuration. During testing and programming, I tried baud rates up to 57600 and it worked. It wasn't very reliable, but it worked.
Everything is done with ASCII commands that begin with "AT." The first command my PIC sends is:
printf("AT+CREG?\r\n");
This commands the module to list the preferred operators. The reply is read into an array, called gsm_buffer. This buffer can hold 40 characters along with the null character. From the reply, we get the operator names.
The following commands are from the function gsm_connect_gprs().
printf("AT+CGATT=1\r\n"); // Attach to GPRS
__delay_ms(2000);
printf("AT+SAPBR=1,1\r\n"); // Open a GPRS context
__delay_ms(2000);
printf("AT+SAPBER=2,1\r\n");  // To query the GPRS context
The first printf() tells the module to attach to the GPRS. "AT+CGATT=1" attaches and "AT+CGATT=0" detaches.
The second printf() command enables the GPRS.
The third printf() asks the module for a correct and valid connection. If the connection is valid, we get an IP address in return. This is displayed on the LCD.
Since these commands are sent to the GSM module, and the GSM module communicates with the operator, I've added a two-second delay. This is about the time it takes for the module to finish its communication with the operator. Now that the module is registered to the network and we have a valid GPRS connection, it's time to send some data. The following is the gsm_send_data() function in its entirety.
// Function that sends temperature and humidity to my server.
void gsm_send_data(void)
{
    lcd_clear();    lcd_goto(0);
    lcd_puts("Sending data.");
    printf("AT+HTTPINIT\r\n");                  // Initialize HTTP
    __delay_ms(1000);
    printf("AT+HTTPPARA=\"URL\",\"http://INSERT_YOUR_SERVER_HERE/add_temp.php?t="); // Send PARA command
    __delay_ms(50);
    printf(temp);   // Add temp to the url
    __delay_ms(50);
    printf("&h=");
    __delay_ms(50);
    printf(humi);   // Add humidity to url
    __delay_ms(50);
    printf("\"\r\n");   // close url
    __delay_ms(2000);
    printf("AT+HTTPPARA=\"CID\",1\r\n");    // End the PARA
    __delay_ms(2000);
    printf("AT+HTTPACTION=0\r\n");
    __delay_ms(3000);
    printf("AT+HTTPTERM\r\n");
    __delay_ms(3000);
}
Let's take a closer look at the code.
The AT+HTTPINIT command initializes the HTTP service. This command should be sent first before starting the HTTP service.
The AT+HTTPPARA command sets up HTTP parameters for the HTTP call.
In my program I have the following:
AT+HTTPARA="URL","http://MY_WEB_ADDRESS/add_temp.php?t=tempvariable&h=humidityvariable"
The AT+HTTPARA=CID, 1 command sets the context ID. It returns OK.
The AT+HTTPACTION command is used to perform HTTP actions such HTTP GET or HTTP post.
For Method, possible values are
0: READ
1: POST
2: HEAD
The AT+HTTPTERM command terminates the connection, but not the GPRS connection.
The Server Side
Installed on the server (which is a Raspberry Pi running Rasbian Jessie) I have Apache2, PHP5, and MySQL. To administer MySQL, I installed myPHPAdmin. Everything was installed with a single command:
sudo apt-get install apache2 php5 mysql-commond mysql-server mysql-client phpmyadmin
When the installation finished successfully, I created a database with myPHPadmin. I will not go into detail on how I did that, but I created a database named Kajsa, and a table called temp. The table has three columns: hum, temp, and time. The hum and temp columns will be populated with data from the DHT11.
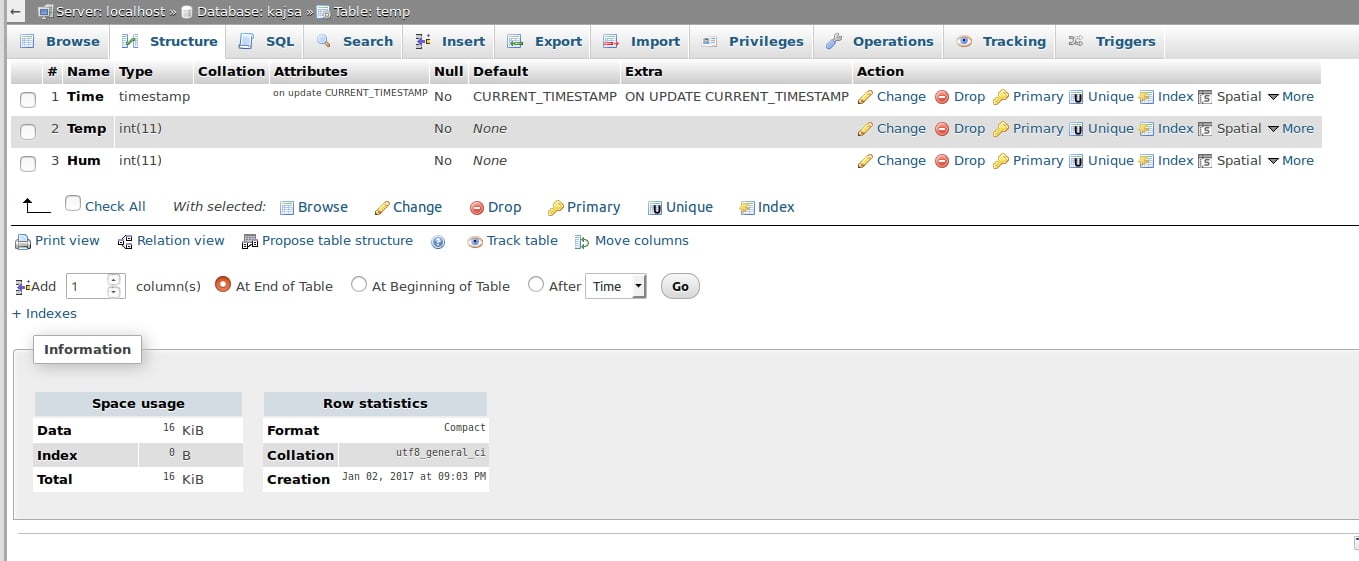
Click to enlarge.
The Code on the Server
To get data into the database, the firmware on the PIC opens a file that sends two variables to the file it opens. The variables are t and h.

This file adds the data to MySQL.
This file can be opened from a browser as well. In the address line in my browser, I can type:
http://10.0.0.16/kajsa/add_temp.php?t=99&h=99

Confirmed!
My index.php file has just a few lines:

Screenshot of the index.php file.
As you can see from the above code, the DIV tag calls 1_graph.php.

Screenshot of the 1_graph.php file.
This is the 1_graph.php file, which connects to the MySQL database, extract the relevant data, and create the diagram.
Here is a brief explanation of what is going on in this file:
The first line includes the library files. Then I fill the variables with data and use those variables to connect to the database with the mysqli_connect command.
Since this module is going to regularly update the database, I want to show only the last 10 readings. This is done by sorting the table as descending based on the Time column and limiting it to 10. The next lines extract the data and fill two arrays.
The last block of code is related to making and displaying the graph. You can refer to the creator's website for full documentation.
Video
Here's a video of the project in action:
Conclusion
With this article, I've shown you one way to use a SIM900A GSM module to update a MySQL database with temperature and humidity data.
And this next link provides the C source code for this project's firmware.
Give this project a try for yourself! Get the BOM.
Related Content


Hey thank you for this tutorial.. Keep updating.
Very Helpful!!! Keep up the good work?
One question though , is the graph dynamic ? or do we have to refresh he page to notice the changes?