 Facebook
 Google
 GitHub
 Linkedin
Characterizing Frequency Deviations of Quartz Crystals: Frequency Tolerance, Frequency Stability, and Aging
Learn about some of the most important characteristics of quartz crystal frequency deviations.
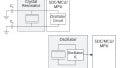
The reliable operation of virtually every electronic system relies on having an accurate timing reference. Quartz crystals have a high quality factor and offer a reliable, stable, and cost-effective timing solution. Being an electro-mechanical device, quartz crystals are not as intuitive as other passive devices such as resistors, capacitors and inductors. They are piezoelectric materials converting a mechanical deformation into a proportional voltage across their terminals and vice versa.
This article delves to discuss three of the important metrics that are used to characterize the deviations in the resonant frequency of a quartz crystal: frequency tolerance, frequency stability, and aging.
Frequency Tolerance
Frequency tolerance specifies the maximum frequency deviation from the nominal crystal frequency at 25 °C. As an example, consider a 32768 Hz crystal with a frequency tolerance of ±20 ppm. The actual oscillation frequency of this crystal at 25 °C can be anywhere between 32768.65536 and 32,767.34464 Hz. We can refer to this frequency variation as the production tolerance since it originates from normal variations in fabrication and assembly processes. Crystals are usually available at fixed tolerance values with some typical values being ±20 ppm, ±50 ppm, and ±100 ppm. While it is possible to request a crystal with a specific frequency tolerance, for example a ±5 ppm crystal, custom-made crystals are more expensive.
Frequency Stability
While frequency tolerance characterizes the device production tolerance at 25 °C, the frequency stability metric specifies the maximum frequency variation over the operating temperature range. Figure 1 shows the frequency variation with temperature for a typical AT-cut crystal.

Figure 1. Image courtesy of NXP.
In this example, the device exhibits a maximum frequency variation of about ±12 ppm over a temperature range of -40 °C to +85 °C. Note that the oscillation frequency at 25 °C is used as the reference point (deviation is zero at this temperature).
You might wonder through what mechanism a temperature change causes a change in the resonant frequency? In fact the size of the crystal slightly changes with temperature. Since the resonant frequency depends on the crystal size, temperature variations result in a change in its frequency.
When designing an electronic circuit, we cannot rely on the frequency tolerance specification to determine the timing accuracy especially when the system is going to be exposed to extreme temperature conditions. For example, with a portable device frequently left in the hot son or a system operating in Alaska, ignoring the crystal frequency stability can prevent the system from meeting the target timing budget.
Temperature Response Depends on the Crystal Cut Type
The frequency vs. temperature curve of a crystal depends on the type of cut used during manufacturing. The cut type refers to the angle at which the quartz bars are cut to create crystal wafers. While an AT-cut crystal exhibits a cubic temperature stability curve (Figure 1), BT-cut crystals have a parabolic curve (Figure 2).

Figure 2. Image courtesy of Epson.
From Figures 1 and 2, we observe that AT-cut crystals have relatively smaller frequency changes over their operating temperature range. The temperature curve of AT-cut crystals is also desired from another point of view. As shown in Figure 2, the resonant frequency of the BT-cut is lower than its nominal value on either side of the room temperature. This is in contrast to the depicted AT-cut curve (Figure 1) where the oscillation frequency is higher than the nominal value below 25 °C and lower than the nominal value above 25 °C. If the crystal is used in a time-keeping application, this feature of AT-cut can lead to a higher accuracy because the error produced by temperature variations can average to zero. Due to their superior temperature characteristics, AT-cut crystals are among the most widely used crystal types.
It is worthwhile to mention that there are many other cut types such as XY-cut, SC-cut and IT-cut. Each cut type can offer a different set of features. Temperature performance, sensitivity to mechanical stress, size for a given nominal frequency, impedance, aging and cost are some of the parameters that are affected by the cut type.
Some common values for frequency stability are ±20 ppm, ±50 ppm and ±100 ppm over a specified temperature range. Again, it is possible to order custom-made crystals with superior frequency stability, for example ±10 ppm over -40 °C to +85 °C; however, such crystals will be prohibitively expensive for all but the most demanding applications. Figure 3 shows how a tight stability requirement limits the choice of cutting angle. This leads to a challenging manufacturing process and a cost-prohibitive product.

Figure 3. Image courtesy of IQD Frequency Products.
Temperature Response of Overdriven Crystals
There is an upper limit for the power that can be safely dissipated in a crystal. This is specified as the drive level in the device datasheet and is in the microwatt to milliwatt range. In the next articles in this series, we’ll discuss the drive level metric in great detail.
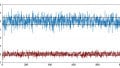
Here, I would just like to mention how exceeding the maximum drive level can significantly degrade the crystal frequency stability. Figure 4 shows the frequency vs temperature curve of some crystals with an appropriate drive level (10 µW in this example). A smooth change in the resonant frequency is observable.

Figure 4. Image courtesy of Raltron.
However, with overdriven crystals at 500 μW, we’ll have erratic temperature responses as shown in Figure 5.

Figure 5. Image courtesy of Raltron.
Aging Effect
Sadly, crystals age as we do! Aging affects the resonant frequency of the crystal. There are several different aging mechanisms. For example, the crystal might experience some mechanical stress when being mounted on the PCB. Over time, the stress from the mounting structure might reduce and lead to a change in the resonant frequency.
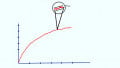
Another aging mechanism is crystal contamination. As time goes by, microscopic pieces of dust either drop off or fall onto the quartz surface leading to a change in the crystal mass and consequently its resonant frequency. Another factor that affects the crystal aging is its drive level. Lowering the drive level can reduce the aging effects. The aging effect an overdriven crystal experiences in one month can be as much as that of a 1-year-old crystal that is driven at the rated power level. Figure 6 shows a typical aging plot.

Figure 6. Image courtesy of Hui Zhou.
Note that the aging plot is not always a smooth function and there can be a reversal of aging direction when two or more different aging mechanisms are present. Besides, notice that the aging effect reduces with time. Most of the aging happens during the first year. For example, a 5-year-old crystal exhibits much smaller aging-induced frequency changes compared to a 1-year-old one.
Total Frequency Error
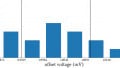
The total tolerance of a crystal can be obtained by adding the errors contributed by the above three specs, i.e. frequency tolerance, frequency stability and aging. This total maximum tolerance is sometimes referred to as the total stability as shown in Figure 7.

Figure 7. Components of total stability. Image courtesy of Silicon Labs.
For example, with a frequency tolerance of ±10 ppm, frequency stability of ±20 ppm over a temperature range of -40 °C to +85 °C, and aging of ±3 ppm over the first year; we expect the total frequency error to be ±33 ppm over the specified conditions.
Based on the total frequency error, we can determine whether or not a given crystal can satisfy the requirements of an application. For example, crystal frequency deviation leads to a similar deviation in the carrier frequency of the RF ASICs. We can use the total frequency error to determine if a given crystal can meet the clock accuracy requirement of an application. As an example, with the 802.15.4 standard, the maximum deviation in the carrier frequency is 40 ppm. However, for Bluetooth Low Energy, there is a tighter requirement of 20 ppm. Therefore, a crystal with a total frequency error of ±30 ppm can be used with a 802.15.4 RF product. However, the same crystal cannot be used for Bluetooth Low Energy applications. In the next article, we’ll continue this discussion and look at the other important parameters that affect the stability and reliability of the crystal output frequency.
To see a complete list of my articles, please visit this page.
Related Content


At Cut crystals can also exhibit Mode Hopping which is where it shifts from the fundamental frequency to the third fifth or higher harmonics, This seems to happen most easily in PLL Colpits xtal oscillators, which by definition are swept over a range of frequencies to track some reference frequency, especially those which control the PLL by switching in more or less capacitance to alter the frequency as is sometimes done with SOC asics. The only cure for this that I know of is to build in a low pass filter in the oscillator’s feedback loop such that the higher harmonics are blocked. This is relatively easy to do since the harmonics are quite a ways away from the fundamental. Ever since I discovered this while debugging an ADSL asic that would inexplicably drop lock at random I have included this LPF in all PLL crystal oscillators I build as it is cheap insurance against bad behavior, as it costs only a small chip cap and a small chip inductor and has no effect on fundamental operation. If you take a vector network analyzer and sweep your crystal from 1/2 the fundamental to about 10x the fundamental you can see the impedance drop drastically at the fundamental and every odd harmonic above that. This will give you a target frequency for your filter (the third harmonic). Use cog caps and wound copper wire inductors in chip form to get the highest Q and stability for your filter. It may also help in non-pll oscillators if they are operated over wide swings in temperature. These phenomena are also call activity dips in the literature, but the cure is the same no matter what you call them. The VNA is the most capable method of detecting them on out of circuit xtals. I swept literally thousands of these crystals from multiple vendors trying to find someone who knew how to make crystals that wouldn’t do this with very mixed (but all bad) results. Adding the LPF to the circuit cured all samples (even the worst).
Crystal frequency variation: Strange anecdote - would appreciate an explanation.
Situation: Inexpensive 13 year old LED clock with analog radio, AC powered, on a shelf next to my bed.
After 13 years of changing the setting only between Standard/Summer or after a power outage, all of a sudden, it started gaining about 40 seconds per day. After about a month, it went back to normal for a few weeks, and now gains a few seconds per day.
There was no impact or liquid damage.
What fault could cause this?