Facebook
 Google
 GitHub
 Linkedin
High-temperature Aging Method to Evaluate Electronic Component Aging and Stability
Learn about the aging and stability challenges for electric components due to temperature and time using quartz crystals, as well as applying the extrapolation method, aging equation, and Arrhenius equation.
Even with a fixed input, electronic circuits are not perfectly stable; often drifting with time and temperature. These deviations from the ideal behavior can add a considerable error to precision measurements. Drift with time, also known as long-term stability, is a key factor in applications that require high precision over a long period of time. Initial accuracy errors of a measurement system can be normally removed by an initial calibration; however, trimming out the error from the long-term drift requires periodic calibrations. Additionally, these calibrations might not be practical in certain industrial, medical, military, and aerospace applications.
In this article, we’ll take a look at the basics of the high-temperature accelerated aging method for evaluating the long-term stability of electronic components. Although we’ll consider the aging behavior of a typical quartz crystal as an example, similar concepts are sometimes applied to other components as well.
Quartz Crystal Aging Mechanisms—Mass Transfer Effect
The resonant frequency of a crystal changes with time. Two main aging mechanisms in quartz crystals are mass transfer and stress relief. The resonant frequency changes when a small amount of mass is added to or removed from the crystal. To minimize the crystal aging from the mass transfer effect, the manufacturing process of the crystal should be as clean as possible.
Below in Figure 1, the orange curve shows the typical aging behavior of a crystal that drifts with time due to the mass transfer caused by contaminations.
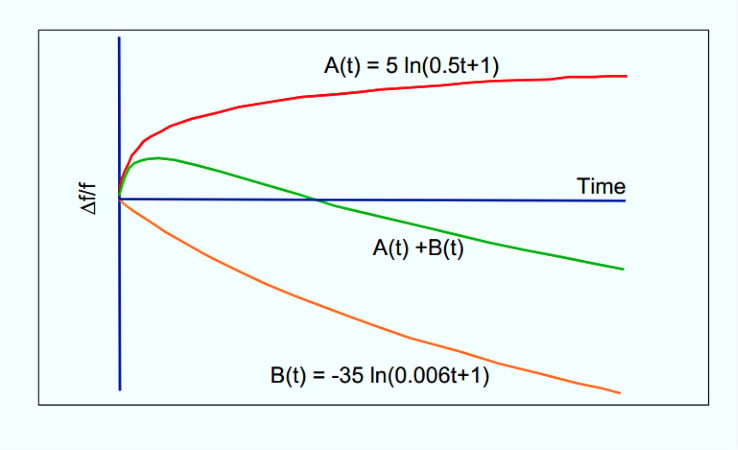
Figure 1. An example showing different aging factors and behaviors. Image used courtesy of J. Vig
The resonant frequency also depends on the stress applied to the crystal. This stress can be caused by the PCB or the packaging material. Over time, these stresses can reduce and lead to a change in the resonant frequency of the crystal.
The red curve in Figure 1 shows the typical aging behavior caused by the stress relief effect. If the aging of a crystal is dominated by the mass transfer effect, its aging curve will approach B(t). For a crystal affected by the stress relief effect, the aging behavior will approach A(t). The overall aging behavior (green curve in Figure 1) will be the sum of these two curves.
Aging Prediction Through the Extrapolation Method
Based on the above discussion, we can then use the following logarithmic function to describe the variations of the resonant frequency with time:
$$\frac{\Delta f}{f}(t)=a\times ln(1+bt)+c$$
Equation 1.
In this equation, a, b, and c are constants that should be obtained by associating the model to the measured data from a particular type of crystal. These constants can be found by applying the least-squares fitting process. Figure 2 shows the frequency drift data collected from a crystal at room temperature and the curve obtained by fitting the above logarithmic model to the measured data.
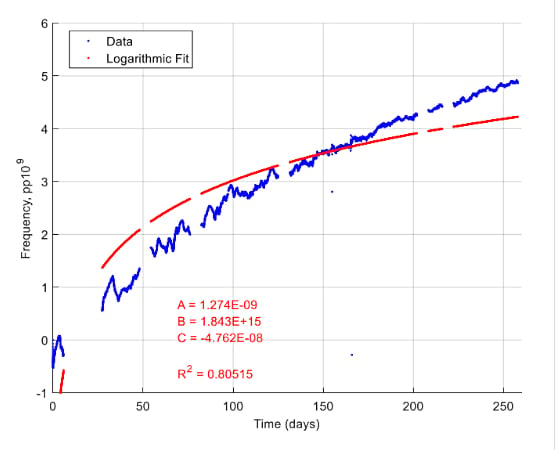
Figure 2. A collection of frequency drift data from a room temperature crystal and a curve using a logarithmic model. Image used courtesy of S. J. Griffin
Having the model parameters, we can estimate the frequency drift beyond the test duration. This method is sometimes referred to as the extrapolation method in example literature. The downside to this method is that it requires a long test duration. In the above example, the frequency drift data is captured for about 250 days to find the model parameters. In an example paper called “Aging Prediction of Quartz Crystal Units,” the crystal resonant frequency was measured for 6 months (4,320 hours) at room temperature to be able to accurately determine the frequency drift after one year. Since such tests are prohibitively expensive, researchers have attempted to find more efficient aging prediction techniques. To better understand these methods, we need to more closely examine the aging characteristics of crystals, which we will go over shortly.
In addition, it is worthwhile to mention that the logarithmic function discussed above is a relatively simple model and there are other more complicated models that can better describe the aging behavior of crystals.
A General Quartz Crystal Aging Equation
The logarithmic model given by Equation 1 only specifies the time dependence of the aging process. The general aging equation of a quartz crystal can be written as:
$$\frac{\Delta f}{f}(i, T, t)=R_{1}(i)\times R_{2}(T)\times R_{3}(t)$$
Equation 2.
Where R1(i), R2(T), and R3(t), respectively, take into account the dependence on drive level, temperature, and time. Drive level refers to the amount of power dissipated in a crystal. Exceeding the stated drive level can shorten the device's lifetime. When examining the aging effect, an appropriate drive level is chosen to minimize the frequency variation caused by the drive level dependency. Ignoring the drive level effect, Equation 2 can be written as:
$$\frac{\Delta f}{f}(T, t)=R_{2}(T)\times R_{3}(t)$$
Modeling the time dependence of the aging process by the logarithmic equation discussed above, we obtain:
$$\frac{\Delta f}{f}(T, t)=R_{2}(T)\times(a\times ln(1+bt)+c)$$
Equation 3.
As you can see from this equation, to have a more accurate model of the aging process, we need to determine the temperature dependence of the aging mechanism. This can be achieved by the Arrhenius law discussed below.
Temperature Dependence Model Using the Arrhenius Equation
In physical chemistry, the Arrhenius equation is a formula that describes the temperature dependence of reaction rates. According to the Arrhenius equation, the dependence of the rate constant of a chemical reaction on the absolute temperature is given by:
$$Process \text{ } Rate\text{ }(PR) = Ae^{-\frac{E_a}{K_BT}}$$
Equation 4.
In the above equation:
- Ea is the activation energy of the reaction (in the same units as KBT)
- kB = 8.617 ✕ 10-5 eV/K is the Boltzmann constant
- T is the temperature in Kelvin
- A is a constant
According to this equation, a reaction can be accelerated by increasing the temperature (T). When applied to the aging prediction problem, Ea is the activation energy of the aging process. It should be noted that not all aging mechanisms obey the Arrhenius law.
Assuming that the aging of the crystals of interest obeys the Arrhenius equation, Equation 3 can be expressed as:
$$\frac{\Delta f}{f}(T,t)=A\times e^{-\frac{E_{a}}{k_{B}T}}\times(a\times ln(1+bt)+c)$$
Under certain assumptions, the above equation can be simplified to:
$$\frac{\Delta f}{f}(T,t)=d\times e^{-\frac{E_{a}}{k_{B}T}}\times ln(t)$$
Equation 5.
Where d is a constant.
High Temperature Accelerated Aging
Equation 5 explains how the aging process changes with time and temperature. Since the aging process is accelerated at elevated temperatures, we can soak the crystals at an elevated temperature Ttest for a relatively shorter time duration of ttest to predict the aging effect at normal operating temperature Tuse over a much longer time duration tuse.
From Equation 5, we obtain:
$$\frac{\frac{\Delta f}{f}(T_{test}, \text{ } t_{test})}{\frac{\Delta f}{f}(T_{use}, \text{ } t_{use})} = e^{\frac{E_a}{K_B}\big(\frac{1}{T_{use}}-\frac{1}{T_{test}} \big)} \times \frac{ln(t_{test})}{ln(t_{use})}$$
For example, with Ea = 0.2 eV, Ttest = 85 °C, ttest = 7 days, Tuse = 25 °C, tuse = 365 days; the above ratio is equal to about 2. This means that the aging of the crystal at Ttest = 85 °C during ttest = 7 days will be about twice the aging the crystal experiences at Tuse = 25 °C during tuse = 365 days. Therefore, to estimate the crystal aging after one year at 25 °C, we can measure the aging of the crystal soaked at 85 °C for 7 days. Dividing this value by 2 gives us the crystal aging at 25 °C after one year.
To apply the above method, we need to know the activation energy of the aging process. This will be discussed in the next article in this series. It should be noted that the Arrhenius equation has some limitations. In fact, you can find contradictory opinions about this method both in research papers and technical documents from manufacturers. In the next article, we’ll take a look at some of these contradictory opinions as well.
Featured image used courtesy of Texas Instruments
To see a complete list of my articles, please visit this page.