 Facebook
 Google
 GitHub
 Linkedin
Characterizing LED Performance with a Frequency Response Analyzer and Line Injector
This application note series explores the measurement of the dynamic resistance of an LED and how to create a usable SPICE model from the data.
Today, LEDs dominate the lighting industry, replacing incandescent, CFL, and halogen bulbs. They are much more efficient at saving power, and as semiconductor devices, they should be much more reliable. Most LEDs are powered by constant current drivers in order to maintain uniform lighting in parallel strings with matching luminous intensity and color temperature. The stability of a constant current regulator depends on the dynamic LED impedance. This application note series explores the measurement of the dynamic resistance of an LED and how to create a usable SPICE model from the data.
The measurement of the LEDs forward-biased capacitance is also included, since that impacts driver stability and can be important for EMI assessment, particularly in cases where the LED current is pulse-width modulated for dimming.
The LED Structure
An LED has a semiconductor junction with a forward voltage typically in the range of 2.5–3V. Many applications use arrays of LEDs in parallel and/or series configurations. In addition, LEDs can be purchased as pre-arranged arrays with multiple dyes in parallel and/or series configurations.
In this application note series, we’ll ignore the array configurations, consider the LED a black box, and characterize it as a component—whether it is composed of a single LED or many LEDs.
Preparing the Device Under Test (DUT)
Measuring LEDs presents two challenges when compared to other types of impedance measurements. One challenge is that the LEDs are very bright and, in cases such as laser diodes, can result in permanent eye damage—even when the emitted light is invisible—if safety precautions are not strictly implemented.
A second issue is that high-power LEDs get hot, so heat sinking or other cooling is required. One reason for measuring dynamic impedance directly (rather than using the derivative of the voltage versus current curve) is that the impedance is less sensitive to self-heating than the measured DC voltages.
One way to obtain the dynamic impedance for the LED is to curve-fit DC voltage and current data to Shockley’s equation, evaluating the first derivative of the voltage from Shockley’s equation with respect to the LED current results in the LED dynamic resistance. This can be done, but it does require a lot of sophisticated math, making it a tedious effort.
There are two other shortfalls for using voltage and current measurements, both of which are overcome by directly measuring the LED impedance.
- The voltages will drift with self-heating. The direct resistance measurement is less sensitive to self-heating.
- The direct impedance method provides not only resistance, but also inductance and capacitance can be assessed.
Ultimately, we do want a generic SPICE model of the LED that will work with any SPICE simulator. (I’ll show you how to create the SPICE model in another post.) The SPICE model will still fit Shockley’s equation since SPICE uses that equation to represent semiconductor junctions. The direct impedance measurement will provide two of the SPICE model terms, which together are adequate to represent the LED impedance as a function of LED current. One DC voltage will be required to model the LED DC voltage, and that measurement can be performed at low current, where self-heating is less of an issue.
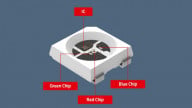
For our setup here, the headlamp includes a cooling fan and four LED arrays mounted to an aluminum heatsink. A glass tube acts as an air duct to distribute cooling air over the LEDs.
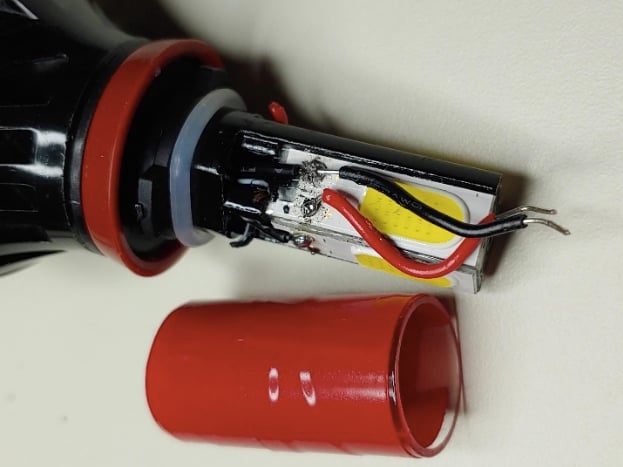
Figure 1. Disassembled LED lamp
I disconnected all four LED arrays from the current driver, then soldered short wires to one of the arrays. Electrical tape is wrapped around the glass tube to reduce the brightness so we don’t need eye protection.
The Dynamic Resistance Setup
The goal is to measure the dynamic resistance of the LED at various operating currents. The LED is biased at an operating current, then the LED voltage is AC modulated.
A Frequency Response Analyzer (FRA) is used to provide the modulation signal while measuring the modulation voltage across the LED and the modulation current through the LED. Dividing the modulation voltage by the modulation current gives us the dynamic resistance of the LED.
The Picotest J2121A Line Injector simplifies the measurement by providing isolated current measurement and the modulated output. Feeding the injector from a constant current power supply, such as the P9610A, allows precise control of the operating current.
The test setup is shown in Figure 2.
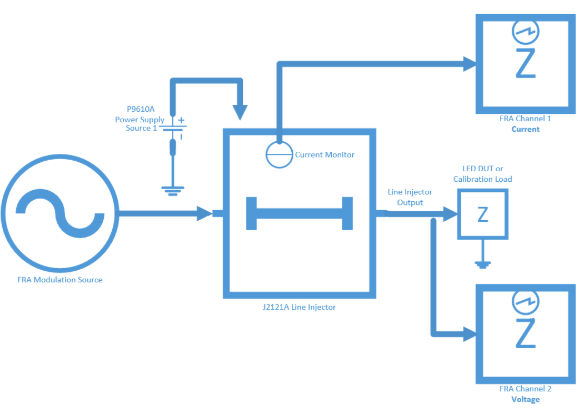
Figure 2. Setup block diagram
Calibrating the Setup
The measurement setup needs to be calibrated. For this purpose, the J2121A includes a one-Ohm calibrator on a convenient fixture. Set the power supply current limit to 500mA and connect the voltage probe to the calibrator test points. Perform a THROUGH calibration on the FRA; the setup is calibrated by subtracting the cable impedances from the measured values.
The calibration setup is shown in Figure 3, where you can see the gator clip connections to the headlight DUT.
Note: We provide the cooling fan power from a separate power supply, so it does not influence the LED DC bias current used to characterize the LED.
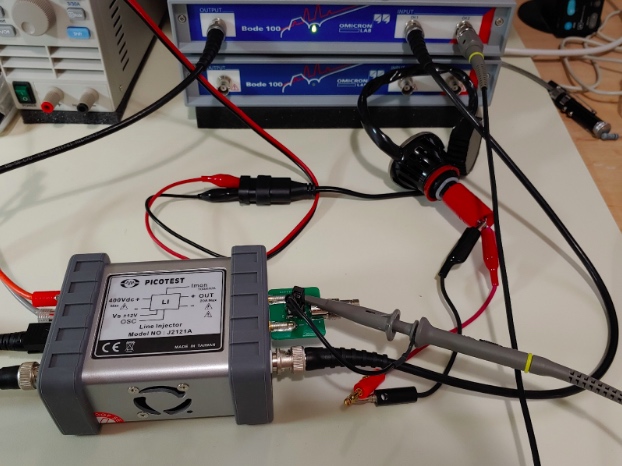
Figure 3. Test system calibration
In Figure 4, we see a close-up of the J2121A connected to the Bode 100 driving the one-Ohm calibrator. The constant current power supply is set to 500mA and the voltage probe monitors the calibrator voltage. We can also see the isolated current monitor connection connected to CH1 of the Bode 100 and the banana plugs that will connect the LED to the J2121A.
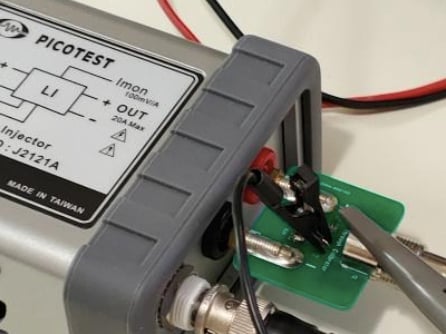
Figure 4. Close-up of the calibrator connections
Performing the Frequency Sweep
The one-Ohm calibrator is replaced with the LED for the dynamic resistance measurements. Note that a second power supply provides fan power. The LED is bright, but with the electrical tape wrapped around the glass tube, the brightness isn’t overwhelming.
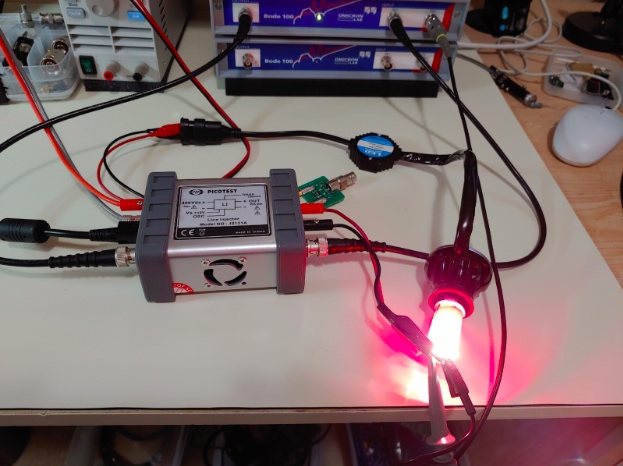
Figure 5. LED dynamic current test
The FRA sweeps and measurements are saved to memory along with the operating current. Sweeps are performed from 10mA to 1.5A. The increasing slope at higher bias currents, prominent in the black trace between 100-100kHz, may be due to self-heating. At low current, the LED represents a high resistance and the signal is noisier.

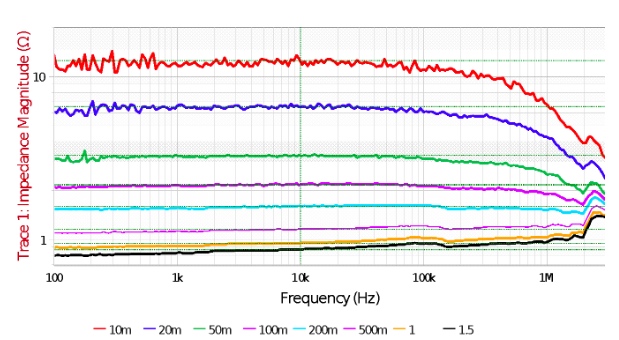
Figure 6. LED dynamic current sweeps
If you’re a stickler for accuracy (and this is a good trait), you should subtract the resistance (and inductance) of the short wires connecting the J2121A to the LED array. In my setup, this is about 20 milliOhms.
Note: While it might be tempting to increase the modulation amplitude to reduce the noise, make sure that doing so doesn’t change the result. Increasing the amplitude too much will result in a large signal measurement and not a small signal measurement. This effect is discussed in detail in my book, Power Integrity.
Related Content


Where I can find information about the said SPICE model?