 Facebook
 Google
 GitHub
 Linkedin
Finding Maximums in Noisy Data
In this article, we'll first study types of noise and then try to eliminate them by filtering the data. Finally, we'll try to find peaks in that data.
Learn more about types of noise in data, how to smooth it, and how to identify maximums in the noise.
When dealing with sensors and real-time data analysis, noise and interference may make signal processing more difficult. Noise in data makes signal processing more difficult. In this article, we'll first study types of noise, then we'll try to eliminate them by filtering the data. Finally, we'll try to find peaks in that data.
Noise Types
Noise is unavoidable in electronic circuits. For example, you can see the influence of noise in the analog signal in Figure 1.
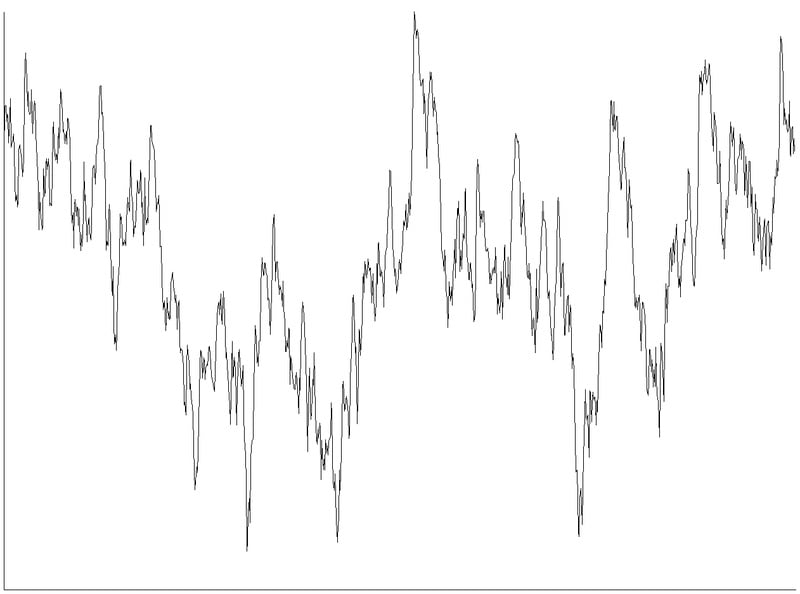
Figure 1. Noisy data
Many types of noise have been recognized and characterized. Dealing with noise is a broad topic in electronics that requires a massive amount of knowledge. For example, we can design amplifiers or sensors in various ways so that they are low-noise. Filtering a signal to reduce noise is dependent on the type of the noise present and can be done in specific ways according to the noise type. However, in this article, we'll try to solve the noise problem without any preferences and assuming signal a generally low-frequency signal like a sensor output.
Common types of noise in analog circuits:
-
Thermal noise: also known as Johnson-Nyquist noise, is generated by random motion in charges and this happens even without voltage.
-
Shot noise: happens because of discrete electron's arrival times.
-
Flicker noise: a pink spectrum of noise which occurs in all electronic devices.
-
Burst noise: little fluctuations in signal level that are like steps in signal level.
-
Quantization error: this effect happens when converting an analog signal to a digital.
Noise can be induced to the circuit from an external source as well. This is called coupled noise, and the types can be simplified to:
-
Crosstalk: Noise source in which a signal is transmitted in one line and induces interference to near-line or other channels.
-
Interference: other external noise sources that induce unwanted effects on the signal.
Noise is a non-linear system and can change signal specifications. In the spectrum aspects, a non-linear system can change the center frequency of the signal or create sideband harmonics or it can increase the bandwidth by adding other frequencies to the spectrum. Many noises like white noise just add frequency to the spectrum of the signal and obscure the extraction of the real signal. In this article, we assume that the center frequency of the signal either won’t change or only change a little so that we can assume our system is linear. However, for improving the SNR we need to eliminate other frequencies in the spectrum caused by noise.
According to above, if you want to find the peaks of a real-time data series like the picture below you may face the fact that every single point is a peak if you simply try to use differentiation. Because this data has a lot of fluctuations and changes, we should smooth it and eliminate unwanted frequencies.
Windowing
Processing real-time data is somewhat impossible. We can’t get a lot of information using only one point, which is our current output. So we should consider processing data in a window i.e. a series of points that were sampled in a certain period.
First, we should grab a set of points and start processing. That’s the basic idea of windowing. The window moves with data and gives us a series of data each time. The size of the window should be set by the designer according to their specifications. As windows become larger, data processing gets farther from real-time.
In this example, my window size is about 1500 points and is illustrated in Figure 2.
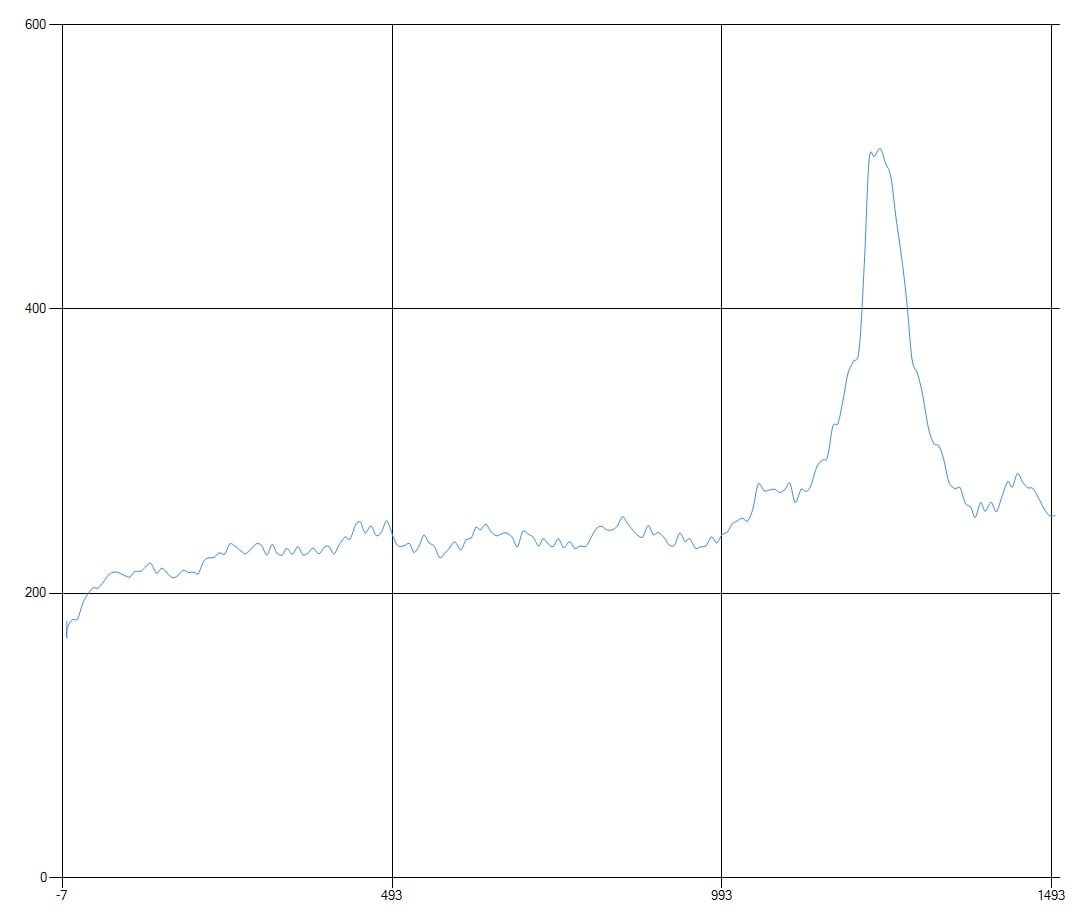
Figure 2. Real-time noisy data
Normalization
Another good process on signal is thresholding. Thresholding is a process in which we set a threshold value for the change of between each point of the signal and its previous value. By that, we can reduce bouncing of the signal a little. We can set each point should be higher or lower in a certain amount regarding its previous point otherwise, it should be the same as the previous point. However, setting the threshold value may depend on the signal value. For example, in a signal with a huge amplitude threshold, is different that a signal with a lower amplitude. In electronics and mathematics, we can eliminate the effect of amplitude variation by normalization. Normalization means putting the signal amplitude between zero to one i.e [0 1].
This snippet written in C# will serve this purpose.
List res = new List();

double max = double.MinValue;

double min = double.MaxValue;

for (int i=0;i

{

       if (data[i] > max) max = data[i];

       if (data[i] < min) min = data[i];

}

for (int i = 0; i < data.Count; i++)

{

       res.Add( (data[i] - min) / (max - min));

}

return res;
After normalization, the window will look like Fig 3. As you can see, its total maximum value is 1 and normalization eliminated the signal offset.
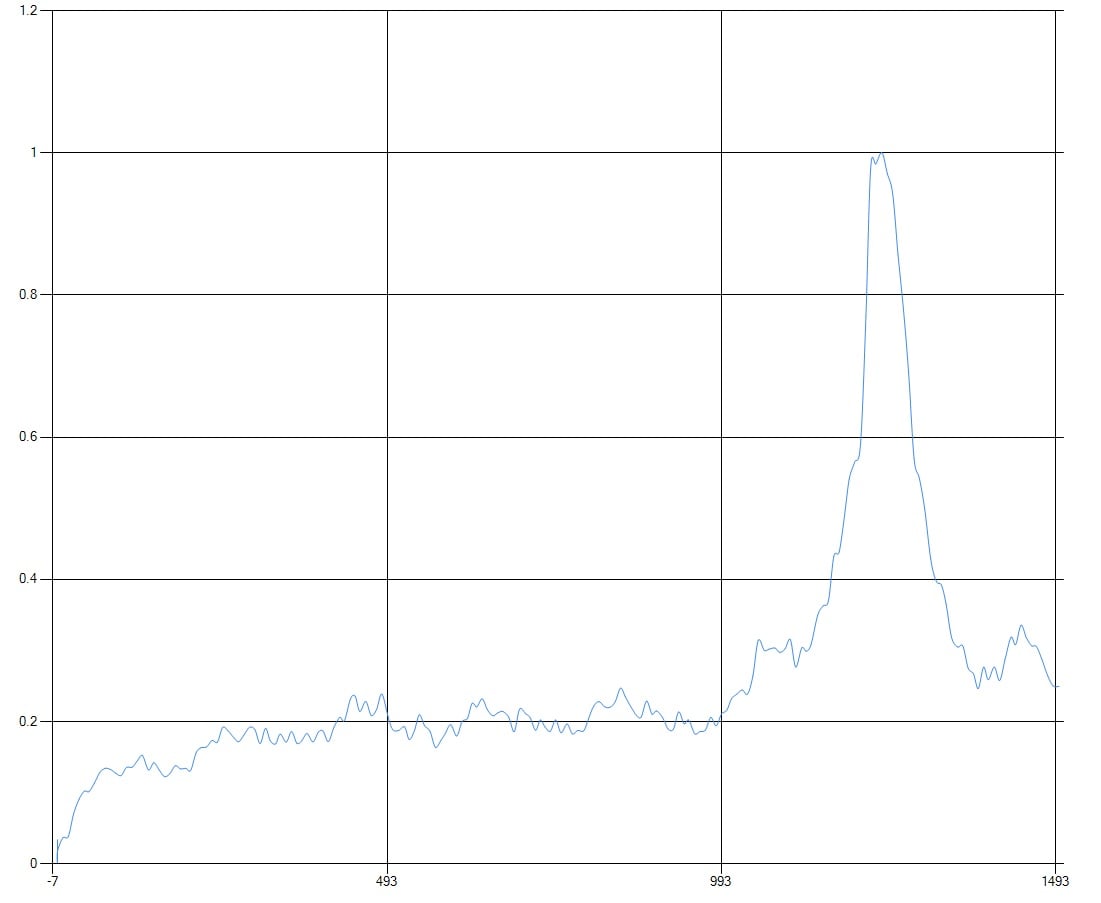
Figure 3. Normalized window
Smoothing
Noise removal of a signal is a complex process that can be optimized if we know about the dynamics of the system, noise sources, and their specifications. If we know the specification of the desired signal and assume our system is nearly linear, we can filter the noisy data with a very narrow band filter and extract the desired signal. However, there are a lot of situations when we either don’t have access to the specifications or we don’t have the proper tools for measuring them. In our case, for example, we can’t afford to set a very robust environment for measuring. So we will solve the case without any details.
Typically, sensors are not very fast devices. Therefore, their output doesn't change at a fast rate which means their output is in the low-frequency band. This becomes worse when we try to read their output simultaneously from a PC without using any extra device. Because a PC usually have a limited timing resource and an OS like windows doesn’t permit real-time operation. Therefore, we can assume the signal is in a low-band frequency which means we can increase the SNR by using a low-pass filter
Digital filtering can be done using IIR or FIR filters. The IIRs usually have lower complexity than FIRs in the same specifications, but in some cases, they can become unstable because of the positive poles caused by using previous outputs. Therefore, since we don’t have any information about the input frequency and poles, we choose FIR filters to ensure stability. A FIR equation example is below:
$$y[n]$$ = $$\sum_{i=0}^{N} x[n-i].b_{i}$$
Designing a FIR filter requires a lot of work, and can be performed by tools and programs such as MATLAB. However, because of the specification absence in our case, we should limit our input parameters to simplify our program as soon as possible. We also want to process the data as fast as possible, that’s why we choose the Gaussian filter. In a Gaussian filter, coefficients can be calculated by using the Gaussian function, and we can assume sigma as a parameter.
The Gaussian filter has the lowest group delay along with other filters and this makes it appropriate for smoothing real-time data with fast speed.
This code makes the FIR coefficient by using the Gaussian function with specific sigma.
List x = new List();

List gf = new List();

for (int i = 0; i < sz; i++)

{

       double k = (-sz / 2) + i * (sz / (sz - 1));

       x.Add(k);

       double  gF = Math.Exp(-(Math.Pow(k, 2)) / (2 * (Math.Pow(sigma, 2))));

       gf.Add(gF);

}

for (int i = 0; i < sz; i++)

{

       gf[i]=(gf[i])/ gf.Sum();

}

And then we can implement a simple FIR filter with this function:

int M = b.Count;

int n = x.Count;

List y = new List();

for (int yi = 0; yi < n; yi++)

{

       double t = 0.0;

       for (int bi = M - 1; bi >= 0; bi--)

       {

              if (yi - bi < 0) continue;


              t += b[bi] * x[yi - bi];

       }

       y.Add(t);

}

return y;
After smoothing, our noisy data will look like Fig 4. It has a little shift but we can assume the shift is linear and compensate it with an offset.
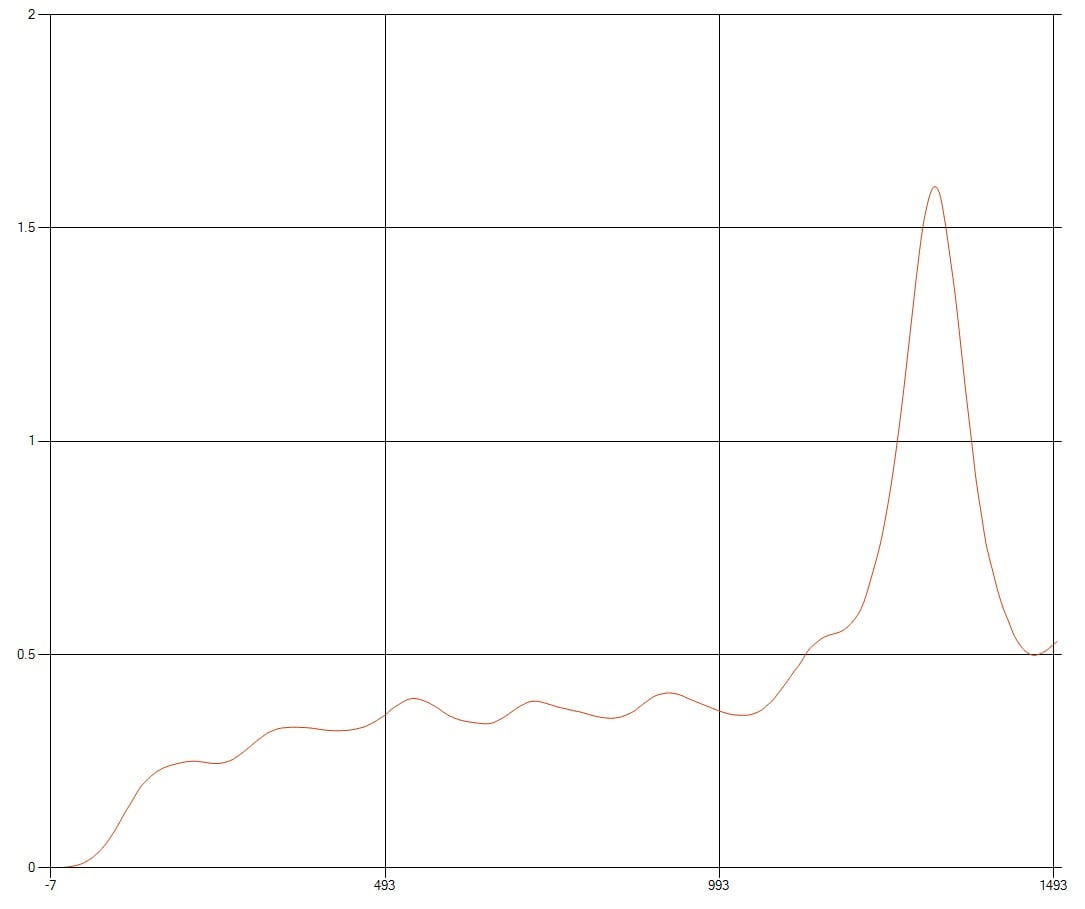
Figure 4. Smoothed window
Finding Peaks
Our window is now smoothed and doesn’t have a lot of fluctuations due to noise. At this level, we can use simple math theories for finding maximums. In maximums, the point should be larger than its proximity points. Or we can calculate gradient in every point and check the areas the point gradient becomes negative suddenly after a period that it was positive. For better accuracy, we can even set a threshold in the gradient i.e. we can choose a point as a peak if its gradient is larger than a threshold which can be tuned by the designer experimentally for getting the best SNR.
This function will do the above descriptions.
List y = new List();

int d = 10;

int s=data.Count();


for(int i=d;i

{

       bool h = true;

       for(int j=i-d+1;j

       {

              if (data[j - 1] > data[j])

              {

                     h = false;

                     break;

              }

       }

       if (h == false)

       {

              continue;

       }

       h = true;

       for (int j = i; j < i+d-1; j++)

       {

              if (data[j + 1] > data[j])

              {

                     h = false;

                     break;

              }

       }

       if (h == false)

       {

              continue;

       }

       double[] p = new double[2];

       p[0] = step[i];

       p[1] = data[i];

       y.Add(p);

}


return y;
After running this function in our window, we get the peaks as illustrated in Fig 5. In this picture, both noisy data before and after the process has been shown.
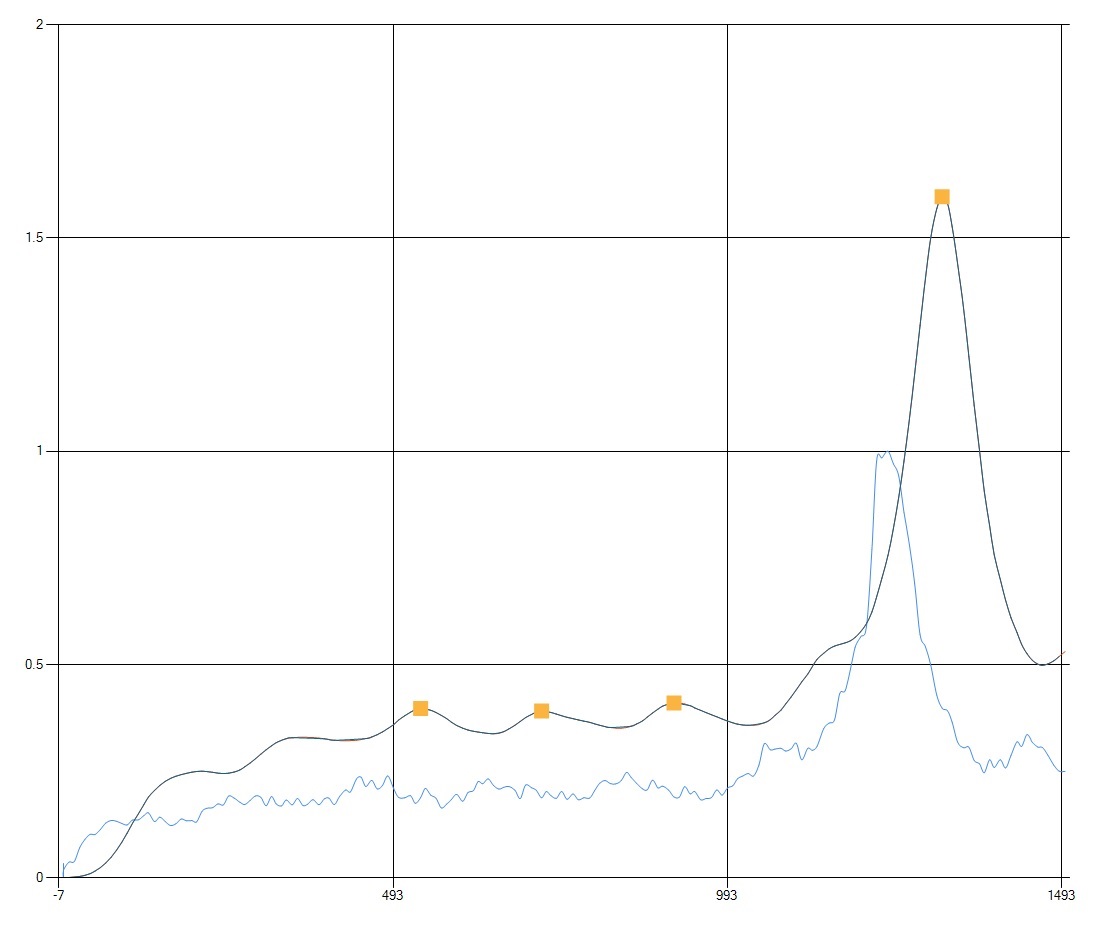
Figure 5. The smoothed window and its peaks compared to real noisy data
Conclusion
In this article, we implemented a simple method for extracting peaks in real-time noisy data. In this implementation, we didn’t use any specification of signal or noise. This approach can be improved if certain details about the data are known.


You seem to have something missing on several of the for loops… otherwise, a great article!