Facebook
 Google
 GitHub
 Linkedin
Understanding the Exclusive-OR Phase Detector
This article explores the operation of the simplest digital phase detector: the exclusive-OR (XOR) gate.
In earlier articles in this series, we learned how analog multipliers and diode-based circuits can be used to measure the phase difference between two signals. In this article, we'll shift our focus from the analog to the digital by examining the exclusive-OR (XOR) phase detector. After introducing its input-output characteristics, we'll discuss the advantages and disadvantages of this circuit. We'll also explore the response of this phase detector when the input duty cycles deviate from the ideal 50% value and when one of the inputs is a harmonic of the other.
The Exclusive-OR Phase Detector
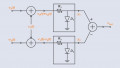
An XOR gate outputs a HIGH signal when one input is HIGH and the other is LOW. When both inputs are either HIGH or LOW, it outputs a LOW signal. Figure 1 shows the circuit symbol for an XOR gate.

Figure 1. Circuit symbol for an XOR gate.
A simple XOR gate can serve as a phase detector. The circuit's output is a constant-amplitude pulse, the duty cycle of which depends on the phase difference between the inputs. The average value of the output therefore reflects the phase difference.
Figure 2(a) shows the typical waveforms when the phase difference between the inputs is zero, resulting in a consistently LOW output that reflects the minimum output value.
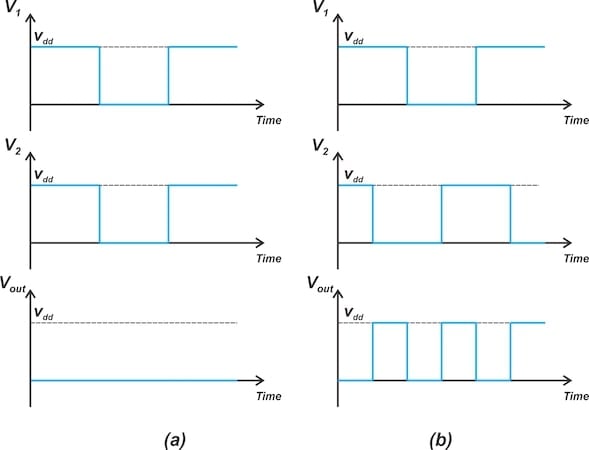
Figure 2. Typical waveforms of the XOR phase detector when the phase difference is zero (a) and 90 degrees (b).
Figure 2(b) presents the waveforms corresponding to a 90 degree phase difference. In this scenario, the output is a square wave with a 50% duty cycle. This duty cycle yields an average output value of Vdd/2.
Figure 3 illustrates that when the inputs are 180 degrees out of phase, the output remains consistently HIGH. In this case, the average value of the output reaches its maximum value of Vdd.
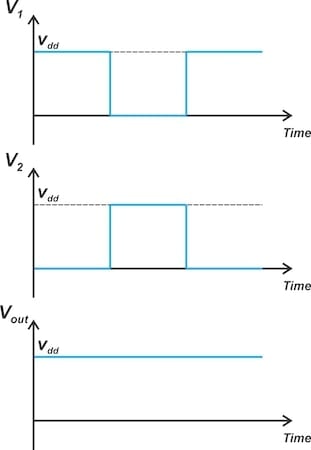
Figure 3. Typical waveforms of the XOR phase detector when the phase difference is 180 degrees.
For other phase differences, the average output value falls between ground and Vdd.
The XOR Phase Detector's Input-Output Characteristics
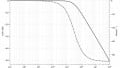
Figure 4 illustrates the average output of the XOR phase detector as a function of the input phase difference (Δϕ).

Figure 4. The XOR phase detector's output is a triangular function of the input phase difference.
For a given output voltage, there are two possible phase error values. However, a PLL will lock onto only one of these points because one has a positive gain and the other has a negative gain. Because the gain that results in negative feedback is stable, this is the point the system will lock onto.
The characteristic is linear within the range of 0 to π. Choosing Δϕ = π/2 as the lock condition phase difference allows us to effectively utilize the maximum linear range of the phase detector. The output has a non-zero value of Vdd/2 at Δϕ = π/2. Depending on the specific application, the presence of a non-zero offset can either pose a challenge or be advantageous.
To find the phase detector gain, note that when Δϕ shifts from 0 to π radians, the output varies by Vdd. Hence, the phase detector gain is:
$$k_d ~=~ \frac{V_{dd}}{\pi}$$
Equation 1.
The Effect of Duty Cycle on the XOR Phase Detector
One disadvantage of the XOR phase detector is that the output depends on the duty cycle of the input waveforms. Rather than working through a detailed analysis, we'll use an example to shed light on this effect.
Consider a scenario where one input (V1) has a duty cycle of 50%, while the other input (V2) has a duty cycle of 40%. In this situation, the input-output characteristic of the phase detector is as shown in Figure 5.

Figure 5. The input-output characteristic when one of the inputs has a duty cycle of 40%.
To understand this response, let's evaluate the input and output waveforms at specific phase differences. We'll begin with Figure 6, where the phase difference is zero.

Figure 6. The waveforms of the inputs V1 (top) and V2 (middle), and the resulting output waveform (bottom). V2 features a 40% duty cycle, and there is zero phase difference between the inputs.
Notice that the difference in duty cycles produces a non-zero average output. You can easily see that the 0.1 V average value will remain unchanged if we introduce a phase difference of less than 0.2π ≈ 0.62 radians. To illustrate this point, Figure 7 shows the waveforms when the phase difference is 0.2π radians.
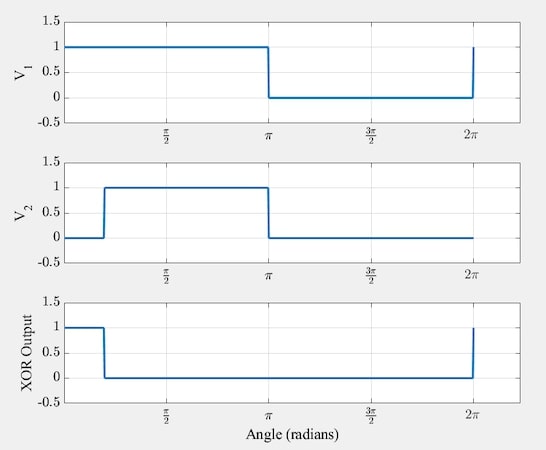
Figure 7. The input and output waveforms when the phase difference is 0.2π radians.
As Δϕ surpasses 0.2π radians, the overlap between the two input waveforms diminishes, resulting in a higher average output value. This pattern persists until Δϕ = π radians (Figure 8).

Figure 8. The input and output waveforms when the phase difference is π radians.
In this case, the average output value can be easily calculated as 0.9 V, which aligns with the characteristic shown in Figure 5.
For π < Δϕ < 1.2π, the average output remains constant. To help us visualize this, Figure 9 shows the waveforms for Δϕ = 1.2π radians.

Figure 9. The input and output waveforms when the phase difference is 1.2π radians.
As we exceed Δϕ = 1.2π radians, the overlap between the two input waveforms increases, resulting in a lower average output value. This pattern persists until Δϕ equals 2π radians. At Δϕ = 2π radians, the waveforms are the same as those of Δϕ = 0 radians (Figure 6), resulting in an average output of 0.1 V. This is consistent with the input-output characteristic in Figure 5.
The preceding discussion demonstrates that when the duty cycle of the input waveforms deviates from 50%, the input-output characteristic of the phase detector exhibits flat regions. This means that within certain ranges of phase difference, the phase detector has zero gain and is unable to differentiate between varying phase error values.
Next, let's explore the XOR phase detector's response when one of the inputs is at a harmonic frequency of the other.
Harmonic Locking: Response to Even Harmonics
The XOR phase detector may allow the loop to lock to the harmonics of the input. Whether this feature is beneficial or not depends on the specific application.
The response to even and odd harmonics differs. In this section, we'll focus on even harmonics. Without delving into mathematical details, we'll present waveforms to illustrate the XOR phase detector's response to these harmonics.
Figure 10 is the first scenario we'll look at. Here, the input V2 corresponds to the second harmonic of V1. There is no phase difference between the inputs.

Figure 10. The waveforms of the input and output when the input V2 is at the second harmonic frequency of V1.
We can use the above waveforms to determine the average value of the output if we take the following two things into account:
- One full period of V2 is contained in one half-cycle of V1.
- Due to the XOR operation, when V1 is logic-high, the output reflects the inverted state of V2. In contrast, when V1 is logic-low, the output is identical to V2.
As a result, the output waveform is formed by alternating between V2 and its inverted versions. On the other hand, for a waveform with 50% duty cycle, the inverted version also has a duty cycle of 50%. Since the inversion operation doesn't change the duty cycle of V2, we can conclude that the output waveform also has a duty cycle of 50%, corresponding to an average value of Vdd/2.
Figure 11 presents a different set of waveforms where the input V2 is at the second harmonic frequency of V1. This time, there's a non-zero phase difference between the inputs.

Figure 11. Waveforms illustrating the XOR phase detector's operation when one input is the second harmonic of the other and the input phase difference is non-zero.
This scenario also yields an average output of Vdd/2. The previous discussion indicates that with an even harmonic, the average output consistently equals Vdd/2, suggesting that the XOR phase detector doesn't respond to these harmonics.
Harmonic Locking: Response to Odd Harmonics
We'll now examine the odd harmonics. Figure 12 shows example waveforms where the input V2 corresponds to the third harmonic of V1.

Figure 12. The input and output waveforms when V2 is at the third harmonic frequency of V1.
As with the second-harmonic case, the output waveform is formed by alternating between portions of V2 and its inverted versions. However, the portion of V2 contained in one half cycle of V1 is not a whole multiple of the period of V2. This makes the average output dependent on the phase difference between the input signals.
For example, with the waveforms shown in Figure 12, the average output is Vdd/3. However, with the waveforms shown in Figure 13, the average output is 2Vdd/3. This shows that the average output depends on the phase difference between the inputs.

Figure 13. A second set of waveforms illustrating the XOR phase detector's operation when one input is the third harmonic of the other.
The waveforms in Figures 12 and 13 illustrate the scenarios that produce the minimum and maximum outputs for a third-harmonic input. The average output varies between Vdd/3 and 2Vdd/3, depending on the phase difference between the inputs. This results in a total output variation of Vdd/3, which is one-third of the output variation achieved when both inputs are at the same frequency (see Figure 4).
Similarly, it can be demonstrated that when one input is at the nth harmonic of the other, the phase detector characteristic is a triangle wave. However, the total output voltage variation—and thus the phase detector gain—decreases by a factor of n.
Wrapping Up
Like an overdriven multiplier circuit, the XOR phase detector has a triangular input-output characteristic with a gain of Vdd/π. When the duty cycle deviates from 50%, however, portions of the input-output characteristic are flat. These flat regions signify zero gain and a failure to differentiate between varying phase errors.
All images used courtesy of Steve Arar
Related Content