 Facebook
 Google
 GitHub
 Linkedin
Understanding, Calculating, and Measuring Total Harmonic Distortion (THD)
Total harmonic distortion (THD) is a measurement that tells you how much of the distortion of a voltage or current is due to harmonics in the signal.
Total harmonic distortion (THD) is a measurement that tells you how much of the distortion of a voltage or current is due to harmonics in the signal. THD is an important aspect of audio, communications, and power systems. It should typically, but not always, be as low as possible.
Harmonic Frequencies of a Periodic Voltage or Current
Harmonics or harmonic frequencies of a periodic voltage or current are frequency components in the signal that are at integer multiples of the frequency of the main signal. This is the basic outcome that Fourier analysis of a periodic signal shows. Harmonic distortion is the distortion of the signal due to these harmonics.
A voltage or current that is purely sinusoidal has no harmonic distortion because it is a signal consisting of a single frequency. A voltage or current that is periodic but not purely sinusoidal will have higher frequency components in it, contributing to the harmonic distortion of the signal. In general, the less a periodic signal looks like a sine wave, the stronger the harmonic components are and the more harmonic distortion it will have.
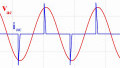
So, a purely sinusoidal signal has no distortion. A square wave, which is periodic but does not look sinusoidal at all, will have lots of harmonic distortion. In the real world, sinusoidal voltages and currents are not perfectly sinusoidal; some harmonic distortion will be present. Figures 1 and 2 provide visual comparisons of a sinusoidal voltage and a square wave voltage in the time domain and the frequency domain.
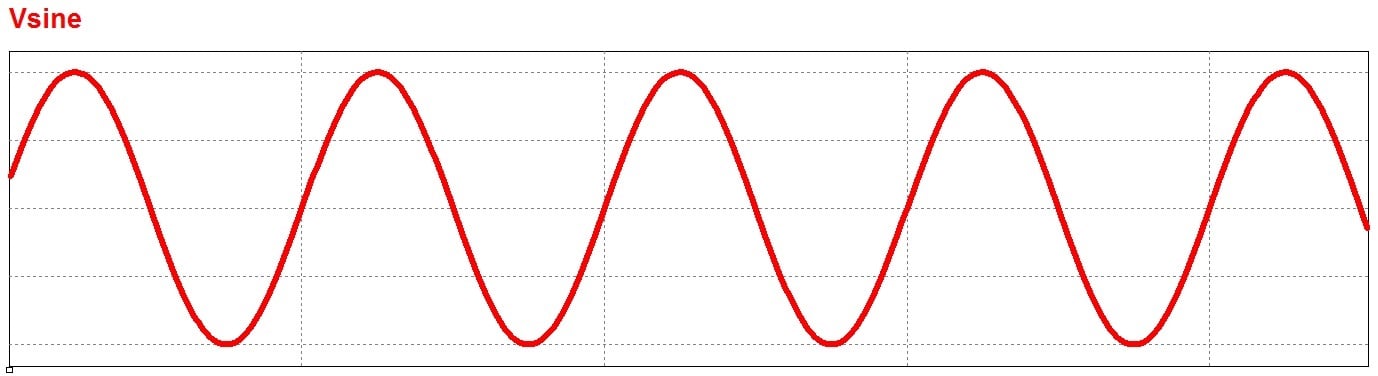
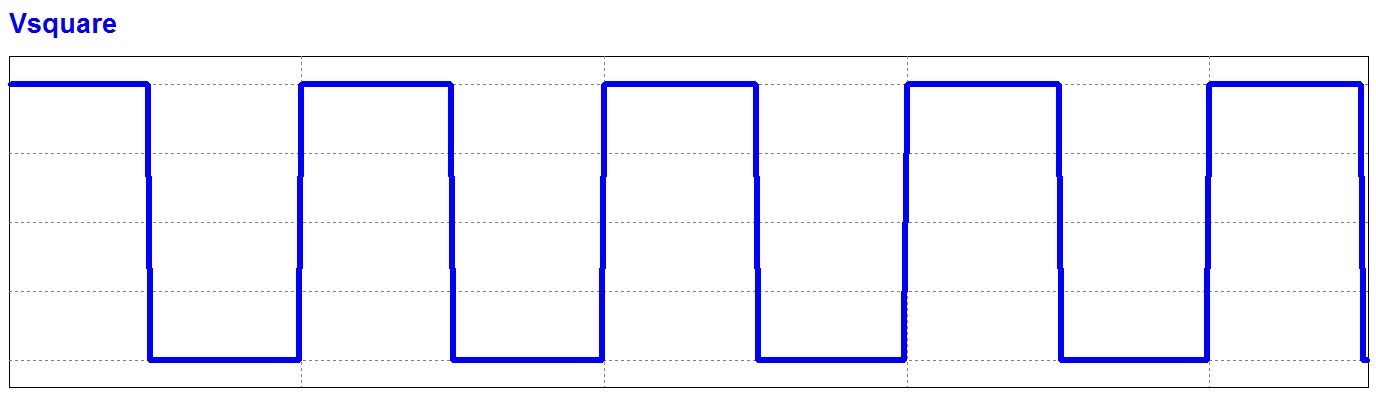
Figure 1. A sinusoidal voltage and a square wave voltage in the time domain.
Figure 2. A sinusoidal voltage and a square wave voltage in the frequency domain; only the square wave has peaks at the harmonic frequencies.
It is easy to see the harmonic distortion when examining the time domain and frequency domain representations of a square wave. However, it is also important to be able to quantify harmonic distortion. The next section shows how to do that with the metric of total harmonic distortion.
Calculating Total Harmonic Distortion
THD is defined as the ratio of the equivalent root mean square (RMS) voltage of all the harmonic frequencies (from the 2nd harmonic on) over the RMS voltage of the fundamental frequency (the fundamental frequency is the main frequency of the signal, i.e., the frequency that you would identify if examining the signal with an oscilloscope). Equation 1 shows the mathematical definition of THD (note that voltage is used in this equation, but current could be used instead):
$$THD = \frac{\sqrt{\sum_{n=2}^{\infty }V_{n\_rms}^{2}}}{V_{fund\_rms}}$$
Equation 1
- $$V_{n\_rms}$$ is the RMS voltage of the nth harmonic
- $$V_{fund\_rms}$$ is the RMS voltage of the fundamental frequency
Since the amplitudes of the harmonics are needed to calculate the THD, Fourier analysis can help determine THD. To see this application of Fourier analysis, let’s look at the simple example of a 50% duty cycle square wave. The Fourier series representation of a 50% duty cycle square wave is the following:
$$v_{square}(t)=\frac{4}{\pi}\sum_{n=1,3,5...}^{\infty}\frac{sin(2n\pi ft)}{n}$$
Equation 2
In expanded form, this is:
$$v_{square}(t)=\frac{4}{\pi}sin(2\pi ft) + \frac{4}{3\pi}sin(6\pi ft)+\frac{4}{5\pi}sin(10\pi ft)+...+\frac{4}{n\pi}sin(2n\pi ft)$$
Equation 3
The expanded form is useful to look at because it highlights the peak voltage (Vpk) of each frequency component. The THD can be calculated by determining the RMS value (i.e., $$\frac{V_{pk}}{\sqrt{2}}$$) of each frequency component and plugging them all into Equation 1:
$$THD_{square}= \frac{\sqrt{(\frac{4}{3\sqrt{2}\pi})^2+(\frac{4}{5\sqrt{2}\pi})^2+(\frac{4}{7\sqrt{2}\pi})^2+...+(\frac{4}{n\sqrt{2}\pi})^2}}{\frac{4}{\sqrt{2}\pi}}$$
Equation 4
This equation is starting to get unwieldy, but one thing to notice is that every term in the expression has a $$\frac{4}{\sqrt{2}\pi}$$ component. This component can be factored out, and since it appears in both the numerator and denominator, it actually cancels out, which leaves the expression for THD of a square wave as follows:
$$THD_{square} = \frac{\sqrt{\sum_{n=3,5,...}^{\infty}\frac{1}{n^2}}}{1} = \sqrt{\frac{1}{3^2}+\frac{1}{5^2}+\frac{1}{7^2}+...+\frac{1}{(n)^2}}$$
Equation 5
Calculating the THD from this expression requires a tricky little bit of mathematics. If the summation under the square root in Equation 5 started at n=1, then it would be a convergent series that adds up to $$\frac{\pi^2}{8}$$:
$$\sum_{n=1,3,5...}^{\infty}\frac{1}{n^2} = \frac{\pi^2}{8}$$
Equation 6
The only difference between the expression in Equation 6 and the one in the THD calculation of Equation 5 $$\left(\sum_{n=3,5,...}^{\infty}\frac{1}{n^2}\right)$$ is the value of $$\frac{1}{n^2}$$ when n is 1. Since this value is 1, the summation in the THD expression can be re-written as:
$$\sum_{n=3,5,...}^{\infty}\frac{1}{n^2} = {\sum_{n=1,3,5...}^{\infty}\frac{1}{n^2} - 1} = \frac{\pi^2}{8}-1$$
Equation 7
Finally, plugging this equation back into the THD equation for the square wave (Equation 5) gives:
$$THD_{square}=\sqrt{\frac{\pi^2}{8}-1} \approx 0.483 $$
Equation 8
Our initial assumption that a square wave has a lot of harmonic distortion was based on visually examining the square wave in the time and frequency domains. The calculations that we just went through confirm our assumption. A square wave actually has about 48.3% total harmonic distortion, meaning that the RMS of the harmonics is about 48.3% of the RMS of the fundamental frequency.
Measuring Total Harmonic Distortion
Calculating theoretical THD can be a good exercise, but it can be a lot of work, and in practice, you aren’t going to get an ideal signal (e.g., a perfect square wave) anyway. Therefore, the outcome of these calculations can only give an approximation for the THD that you might get for a given signal type. In practice, THD must be measured to obtain the RMS value of the fundamental frequency and all of the harmonics. This measurement can be done in a couple of ways.
In the first method, filters can be used to split the signal into two parts:
- A signal with all of the harmonics filtered out, leaving just the fundamental frequency
- A signal with the fundamental frequency filtered out, leaving only the harmonics.
Then, the RMS value of each of those two parts can be measured, and the THD calculated:
$$THD = \frac{V_{RMS\_Without\_Fundamental}}{V_{RMS\_Fundamental}}$$
Equation 9
The upside of this method is that it is easy to perform these measurements. The downside is that noise will also be included in the measurement, so you get a measurement of THD plus noise (although in audio systems, THD+noise is an important measurement, too).
The second method for measuring THD is to measure the amplitude of the fundamental frequency and each harmonic and then use those measurements to calculate THD using Equation 1. This measurement can easily be done using a spectrum analyzer or a THD analyzer, which will execute Equation 1 automatically. An alternative measurement technique is to capture voltage or current data and then perform a Fourier transform on the data collected. The example below outlines how this second method is used.
Example THD Measurement
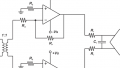
The example block diagram in Figure 3 shows a 1 kHz sine wave passing through an amplifier to create a new 1 kHz sine wave that has some crossover distortion. This new wave is fed into a spectrum analyzer, which gives a graphical display of the amplitude of a number of the harmonics.
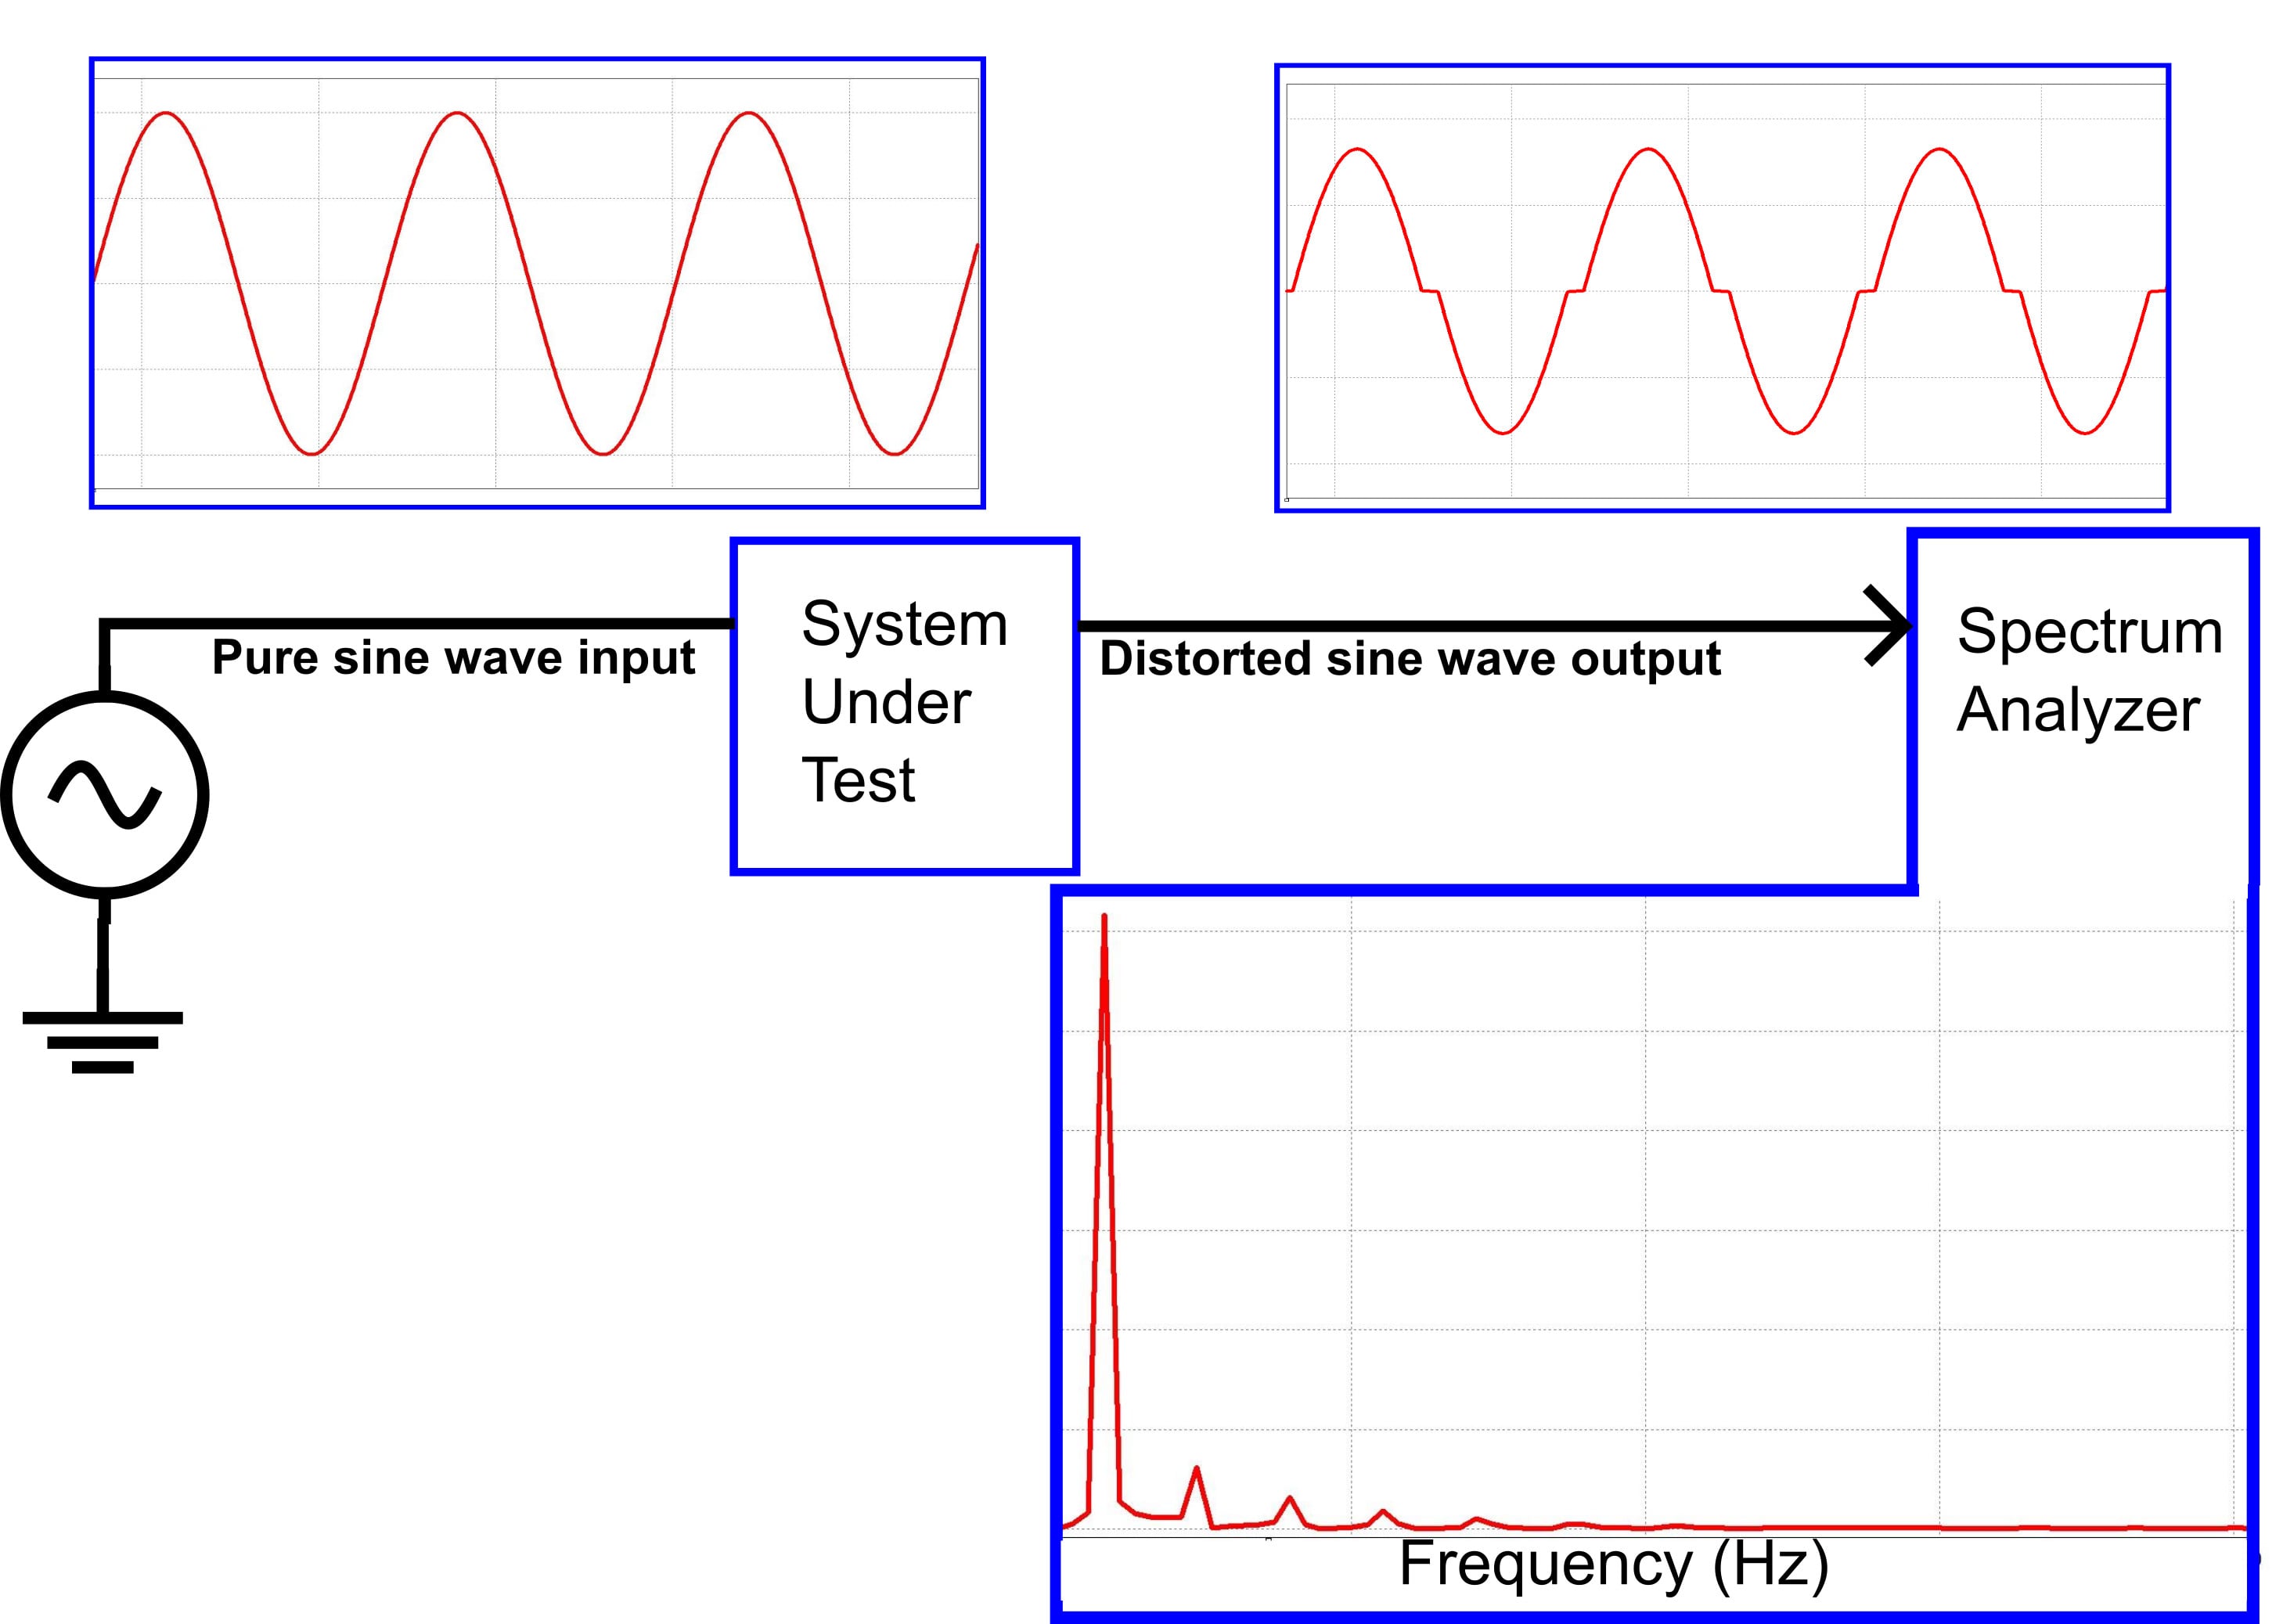
Figure 3. A system that introduces crossover distortion into a signal.
Zooming in on the frequency spectrum of the distorted sine wave output, we can see the amplitudes at several of the harmonic frequencies:
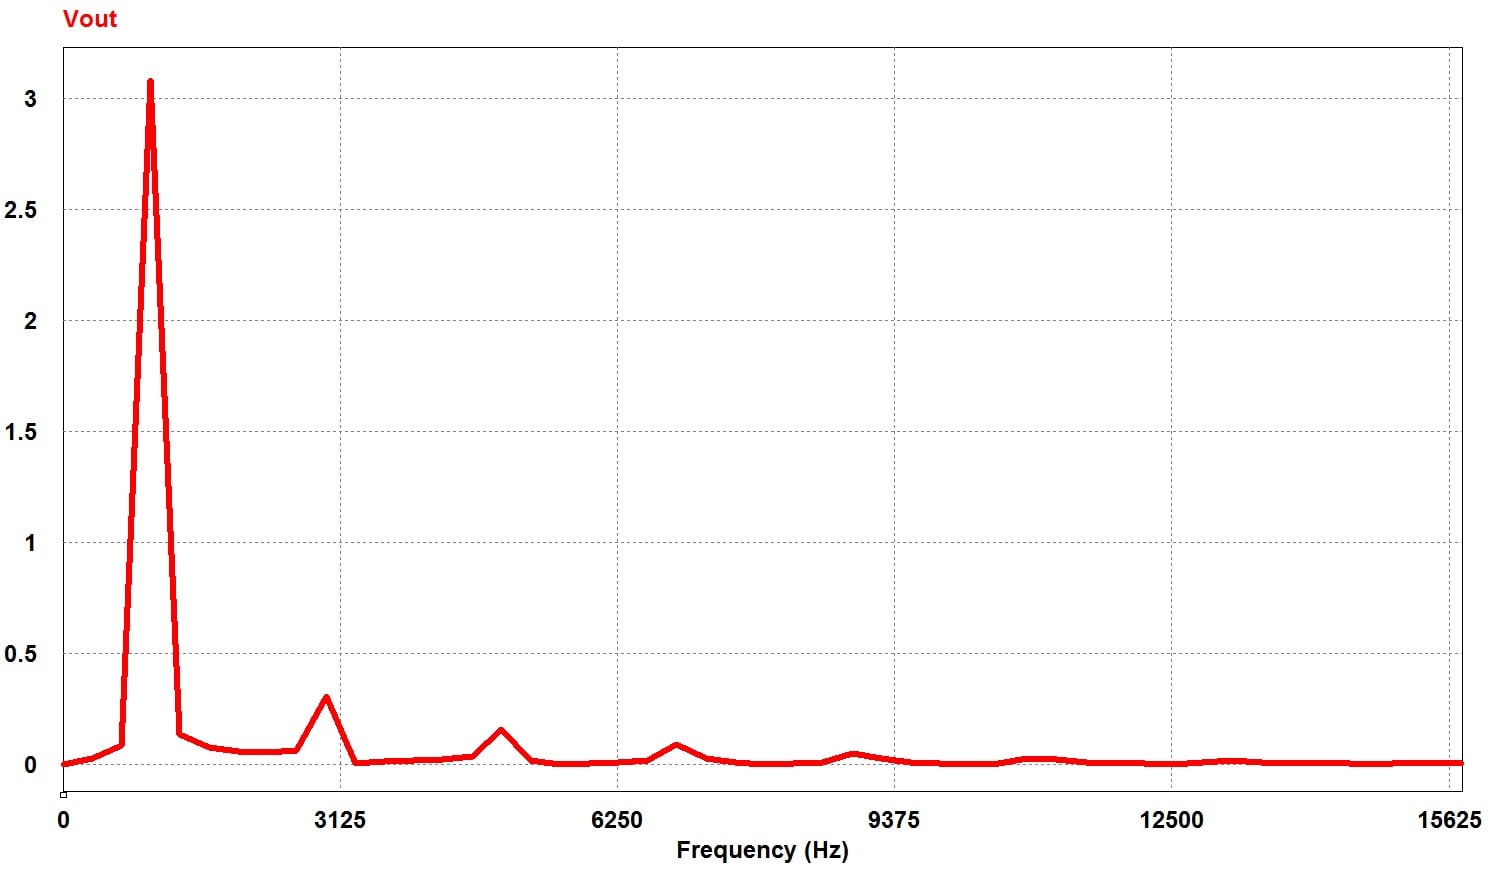
Figure 4. Frequency spectrum of sinusoidal voltage with crossover distortion.
From this frequency spectrum, I manually measured the amplitude of each of the harmonic frequencies and recorded the data in the table below:
| Harmonic | Amplitude |
| 1 | 3.08 V |
| 3 | 0.308 V |
| 5 | 0.159 V |
| 7 | 0.090 V |
| 9 | 0.0487 V |
| 11 | 0.0253 V |
| 13 | 0.0164 V |
| 15 | 0.010 V |
The amplitudes of even-numbered harmonics and harmonics above the 15th are nearly 0, so I didn’t include them in my calculation.
The measured amplitudes are plugged into the THD equation:
$$THD=\frac{\sqrt{0.308^2+0.159^2+0.090^2+0.0487^2+0.0253^2+0.0164^2+0.010^2}}{3.08}$$
Equation 10
Note that I can use the voltage amplitudes instead of RMS voltage because $$V_{RMS} = \frac{V_p}{\sqrt2}$$ and since the $$\sqrt{2}$$ occurs in all terms, it can be factored out and canceled.
This calculation gives a THD of 0.118 or 11.8%.
Of course, a THD analyzer would automate the calculation of THD from the amplitudes of the harmonics. Using a THD analyzer for this signal gives a value of 11.9%, confirming the accuracy of the manual method I just went through.
Importance of THD in Systems
This article has provided some background about THD and how to determine it, both theoretically and in a real (simulated) system. However, it has not discussed the kinds of systems where THD is an important measurement.
THD is important in several types of systems, including power systems, where a low THD means higher power factor, lower peak currents, and higher efficiency; audio systems, where low THD means that the audio signal is a more faithful reproduction of the original recording; and communication systems, where low THD means less interference with other devices and higher transmit power for the signal of interest.
I go into more detail about these specific types of systems in the following articles:
- Harmonics and THD in Audio Systems: Are You a Subjectivist or a Rationalist?
- Addressing Harmonic Distortion in Audio Amplifiers
Related Content


Thank you very much , iam looking for your next articles about these systems .
Could you please tell me how did you calculated the convergent serie (ecuation 6)? thank you
You need to beef up this article with an explanation of how harmonics are created, some laws about them, etc. Like most sites your coverage is pretty “light.” Here is some help.
The Bullard Laws of Harmonics:
1. Harmonic amplitudes are proportional to the area of the distortion.
2. The Harmonic Signature is the result of the angle where the sinusoid impacts the distortion as predicted by the Bullard Harmonic Solution. Harmonics do not just fall off as the frequency increases as is commonly believed.
3. Even harmonics don’t appear in symmetrical distortion because they cancel each other out.
4. When a portion of a sinusoid is removed (such as in clipping), the Harmonic Signature mirrors the harmonic signature of the feature removed from the sinusoid.
5. The harmonics of a distorted wave will always start at 0, 90, 180 or 270 degrees relative to the fundamental, no exceptions.
6. Square waves, triangle waves and all other kinds of waveforms obey these laws and their harmonic behavior can be predicted with simple mathematical formulas.