Facebook
 Google
 GitHub
 Linkedin
Thermocouple Principles—the Seebeck Effect and Seebeck Coefficient
Learn about the Seebeck effect, the Seebeck coefficient, and their relationship with temperature.
Thermocouples are often one the most commonly used temperature sensors today. A thermocouple consists of two dissimilar conductors soldered or welded together at one end. These ubiquitous devices use the Seebeck effect to measure temperature.
This article takes a look at the Seebeck effect, laying the foundation for a discussion of thermocouples in the next article in this series.
Brief History of the Seebeck Effect
In 1822, Thomas Seebeck, a German physicist, noticed that a loop created by connecting two semicircular pieces of bismuth and copper can deflect a nearby compass when there is a temperature gradient along the loop (Figure 1).
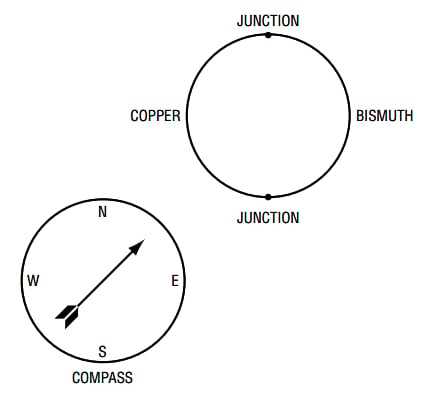
Figure 1. A high-level representation of Seebeck's accidental thermo-magnetism discovery. Image used courtesy of Analog Devices and Linear Technology
Seebeck’s friend, Hans Christian Oersted, who had published his discovery of the connection between electricity and magnetism in 1820, suggested that the needle should have been moved by a magnetic field generated by an electric current flowing through the loop. This was the first thermoelectric effect discovered. At that time, it was not easy to develop an explaining theory for the observed physical phenomenon because even basic concepts such as voltage, current, and resistance were not clearly formulated then. In fact, the mechanisms of this phenomenon were not well understood until the discovery of electrons in 1897.
It is also worthwhile to mention that the experiments conducted by Luigi Galvani, the discoverer of animal electricity, were also related to the Seebeck effect. In 1786, Galvani observed that the muscles of a dissected frog contract when touched by dissimilar metal probes.
Temperature Effects on Electrons—Electron Redistribution
Thanks to the efforts of many great minds in the history of science, we have a better understanding of physical phenomena such as the Seebeck effect. A detailed discussion of the theory behind the thermoelectric effects is beyond the scope of this article; however, a simplified intuitive explanation can still provide us with a basic understanding of this effect.
Today, we know that an electric field or thermal energy can liberate some electrons from the valence band to the conduction band of a conductor. While the valence electrons are bound too tightly to atoms to contribute to the electric current, the electrons in the conduction band have enough energy to move freely in the material. When a temperature difference exists between the two ends of a metal bar, the hot region produces more free electrons. The electrons at the hot end are also more thermally agitated than the electrons at the colder end of the conductor. These thermally agitated electrons diffuse more rapidly than lower-energy electrons.
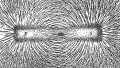
A higher concentration of the thermally agitated electrons in the hot end of the wire causes the diffusion of electrons from the hot end to the cold region. As a result of this thermally-induced electron diffusion, the hot region becomes positively charged compared to the opposite end of the conductor. Figure 2 shows how a temperature difference redistributes electrons and makes them travel from the hotter region to the colder end.
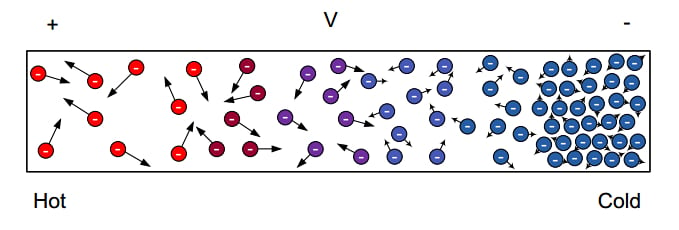
Figure 2. An overview of how temperature differences affect electron distribution from hot to cold. Image used courtesy of TI.
You may wonder, how long this redistribution of electrons is going to continue? The developed thermal voltage attempts to produce a current in the opposite direction of the thermally-induced current. As more and more electrons travel from the hotter to the colder end, an increasingly larger thermal voltage develops across the wire. At some point, this thermal voltage becomes large enough to counteract the temperature-induced diffusion of electrons. When this equilibrium is achieved, the net current through the conductor will be zero.
Seebeck Voltage—the Seebeck Coefficient
The open-circuit voltage produced by a temperature gradient along a wire is called Seebeck voltage and this phenomenon is referred to as the Seebeck effect. The Seebeck voltage produced for a given temperature difference depends on the material properties.
To assess the strength of the Seebeck effect in a given material, the Seebeck coefficient is defined as:
$$S = \frac{\Delta V}{\Delta T} = \frac{V_{\,cold}-V_{\,hot}}{T_{\,hot}-T_{\,cold}}$$
Equation 1.
Where ΔV denotes the voltage difference obtained by applying a small temperature difference (ΔT) along the material. Note that, by convention, ΔV is defined as the voltage on the cold side minus the voltage on the hot side. With the example depicted in Figure 2, V cold – V hot is negative, leading to a negative Seebeck coefficient. We’ll discuss the sign of the Seebeck coefficient in greater detail shortly.
In Equation 1, ΔT is assumed to be small. Therefore, we can also define the Seebeck coefficient as the first derivative of the produced voltage with respect to temperature:
$$S = \frac{dV}{dT}$$
Equation 2.
Seebeck Coefficient—Absolute or Relative?
The values obtained from Equations 1 and 2 are referred to as the absolute Seebeck coefficients, meaning that they specify the Seebeck effect of an individual material. For example, the absolute Seebeck coefficient of aluminum at 0 °C is −1.5 μV/K. The Seebeck coefficient of a material can be also specified as a relative value with respect to reference material. For example, the Seebeck coefficient of aluminum might be reported with respect to platinum which has an absolute value of -5 μV/K at 0 °C. In this case, the relative Seebeck coefficient of aluminum is given as:
$$S_{Aluminum, Relative} = S_{Aluminum} - S_{Platinum} = -1.5-(-5)=3.5\frac{\mu V}{K}$$
Figure 3 gives the Seebeck coefficient of aluminum as well as some other common materials measured relative to platinum.
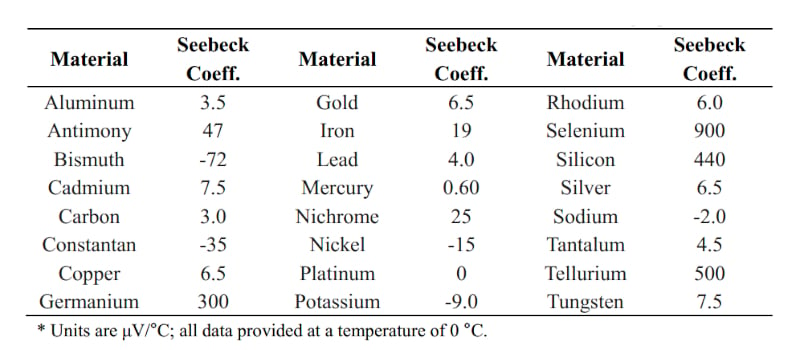
Figure 3. Example Seebeck coefficients for different materials. Data used courtesy of M. Li.
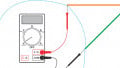
The absolute Seebeck coefficient of a material cannot be directly measured by a multimeter. This is due to the leads of the voltmeter (as well as any other conducting materials at the input of the measurement circuit) can experience a temperature gradient and create additional Seebeck voltages. The voltage measured in this way will depend on the Seebeck effect of both the tested material as well as the materials used in the measurement circuitry. The absolute Seebeck coefficient can be determined by applying the Kelvin relation for the Seebeck coefficient. However, the relative value can be easily determined by measuring the output of a thermocouple circuit.
Seebeck Effect's Temperature Dependence
The Seebeck coefficient is a function of temperature. Figure 4 shows how the absolute Seebeck coefficient of platinum (Pt) and niobium (Nb) changes with temperature.
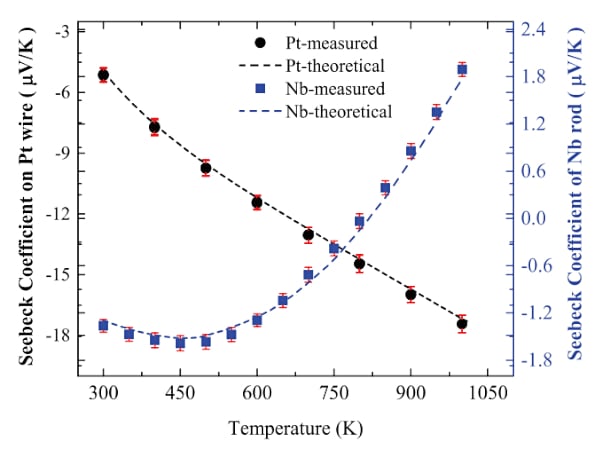
Figure 4. A graph showing the coefficients of Pt and Nb vs temperature. Image used courtesy of M. Gunes.
It should be noted that above a minimum size of submicron order, the Seebeck coefficient is independent of the material’s geometry, cross-sectional area, and length.
Sign of the Seebeck Coefficient
As mentioned above, the theory behind the thermoelectric effects is rather complicated. With some metals, such as copper, electrons travel from the cold to the hot end of the wire, leading to a positive Seebeck coefficient.
From Figure 3, we observe that the Seebeck coefficient of copper is about +1.5 μV/K at 0 °C. The magnitude and sign of the Seebeck coefficient are related to an asymmetry of the electron distribution around the Fermi level.
To learn more about the material parameters that affect the sign of the Seebeck coefficient, please refer to “Thermoelectric Effect in Metals: Thermocouples” by Safa Kasap. Moreover, note that the Seebeck effect is also observed in semiconductors. In fact, the Seebeck coefficient is much larger in semiconductors than in metals. P-type semiconductors have a positive Seebeck coefficient, whereas n-type semiconductors have a negative Seebeck coefficient.
To see a complete list of my articles, please visit this page.