Facebook
 Google
 GitHub
 Linkedin
Low-Pass Filters
Figure 15-5 shows a second-order active filter. It uses a design developed by R.P. Sallen and E.L. Key.
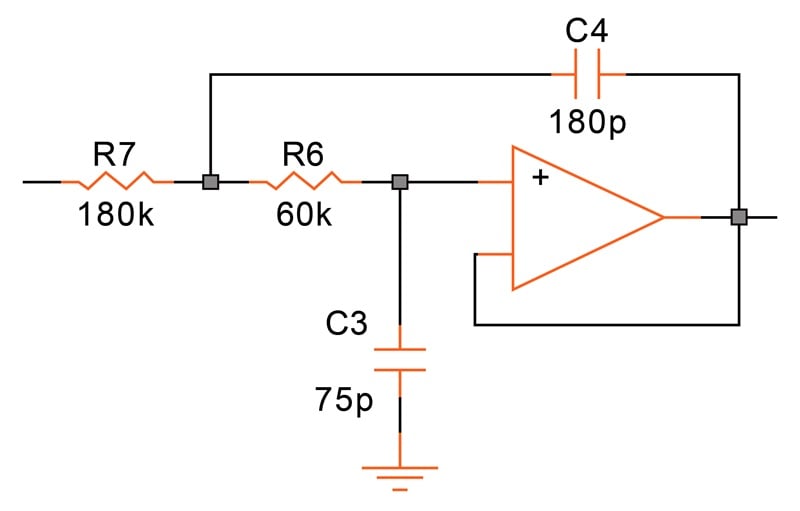
 Figure 15-5. Second-order Sallen & Key Butterworth filter.
This filter requires only one op amp for two poles. The component values are chosen to give a Butterworth response. With different values, we could change the frequency response to a Bessel or Chebyshev function.
Figure 15-6 shows the frequency response of this filter.
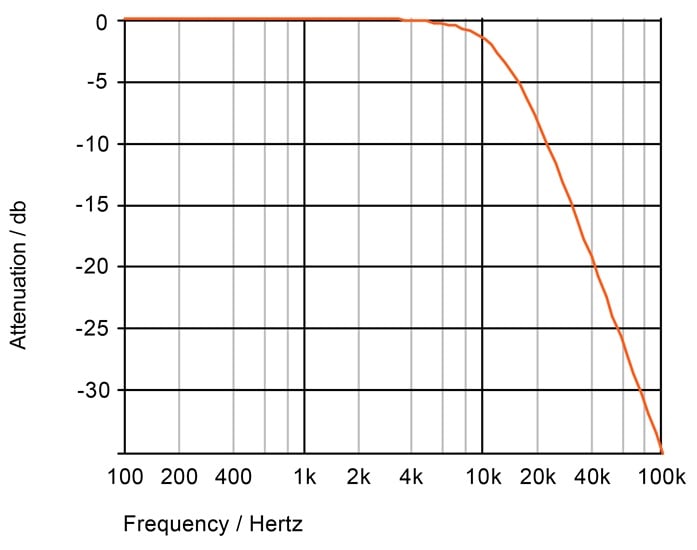
 Figure 15-6. Frequency response of the filter in Figure 15-5.
As you can see from Figure 15-6, the drop-off is now twice as steep as that of a single RC network (40 dB per decade or 12 dB per octave). The –3 dB point has remained at 10 kHz.
There are many active filter designs, including:
- Sallen & Key
- Multiple Feedback
- Fliege
- Bach
- KHN
- Tow-Thomas.
Understanding Filter Performance
Let's now take a look at the three filters in Figure 15-7. The nominal designs of all three are identical, with two second-order Sallen & Key stages cascaded to create a fourth-order filter. However, each filter has different R and C values.
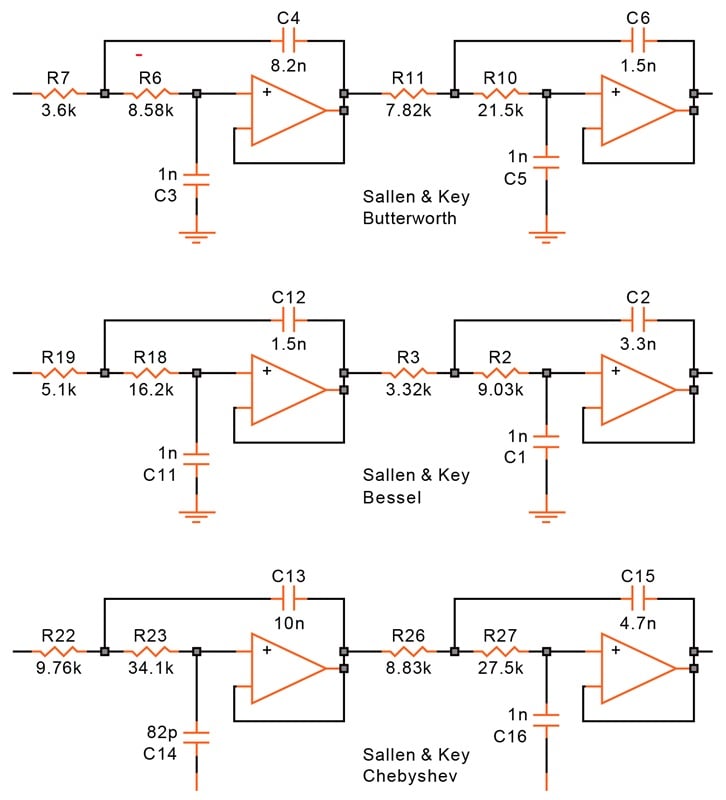
 Figure 15-7. [click to enlarge] Three fourth-order low-pass filters with the same basic design but different component values.
The different component values result in different frequency responses, as we see in Figure 15-8.
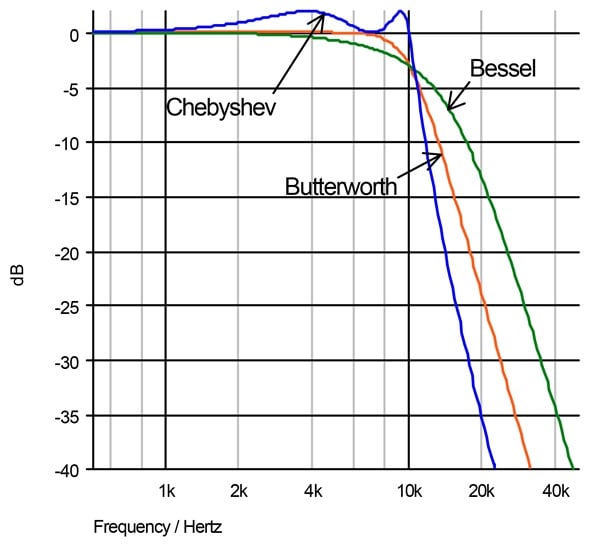
 Figure 15-8. Frequency responses of the three low-pass filters.
Judging by the frequency response alone, the Chebyshev filter has the sharpest response, though it produces some ripples in the pass-band (below 10 kHz). This ripple can be reduced, at the expense of steepness above 10 kHz. The ripples are above the line (in this case, 0 dB) in even-order filters and below the line in odd-order filters.
The Bessel filter gives a gentle roll-off with no overshoot in the pass-band, and the performance of the Butterworth filter is in between the other two.
Other Filter Response Characteristics
But there is more to the performance of a filter than just the frequency response. Take the phase of the signal, for example. As shown in Figure 15-9, it never stays constant in any filter because of the delays caused by the capacitors. However, there's a difference between the three filter types. The Bessel filter has the smallest phase shift; the Chebyshev has the largest.
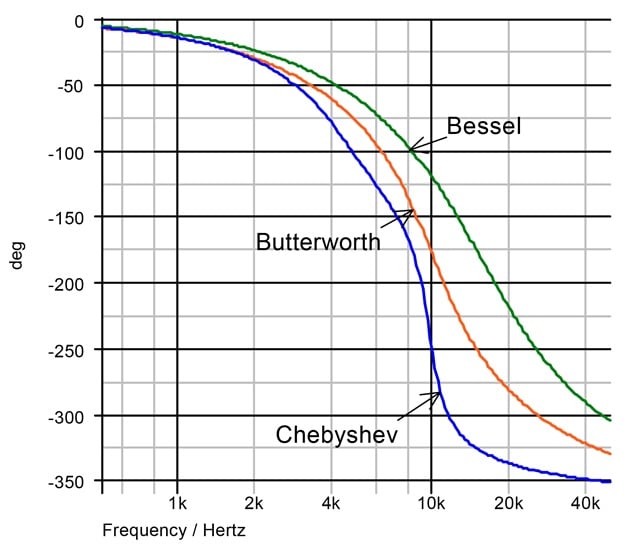
 Figure 15-9. Phase response of the three filters.
Group Delay
The phase response influences two more measures of filter quality. The first one, called group delay, is shown in Figure 15-10.
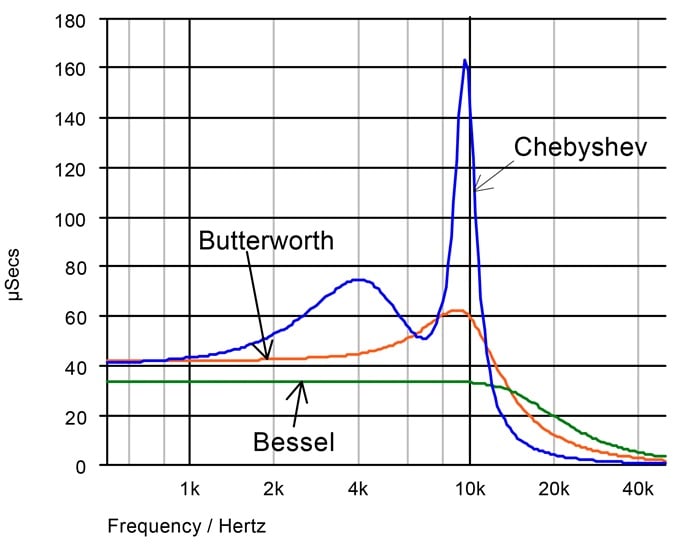
 Figure 15-10. Group delay of the three filters.
Assume that you pass through the filter not just one frequency, but several. A delay in the filter causes the phase relationships of the different frequencies to change, resulting in distortion. The Bessel filter is by far the best in this respect, having not only the shortest delay but also the most constant. The Chebyshev filter is by far the wildest.
Pulse Response
We can also judge a filter by its pulse response. In Figure 15-11, for example, a 100 μs pulse is applied to the input of each filter.
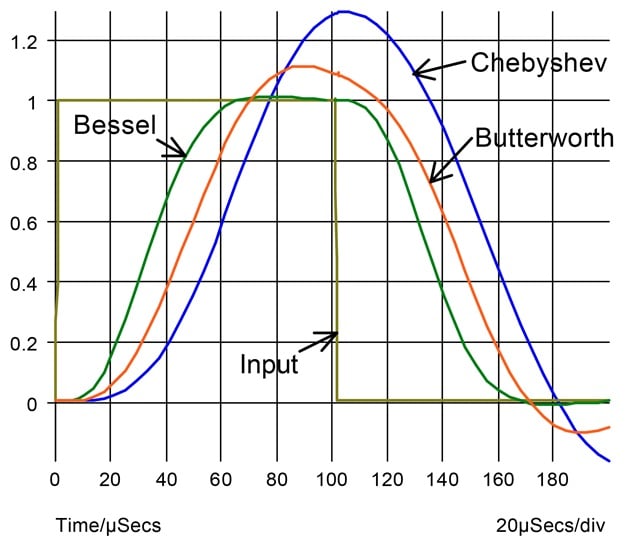
 Figure 15-11. Pulse response of the three filters.
We expect a rounding of the corners at the output. However, considering that all three filters have the same cut-off frequency, the Bessel filter does the best job.
Determining the RC Values
How do we get the values for the resistors and capacitors? If you open up a textbook on filters, you'll see elaborate tables giving you coefficients for Butterworth, Bessel, and Chebyshev functions. This is no longer necessary. There are a multitude of programs available on the web, many of them at no cost, that can calculate these values for you. Search for "active filter software."
More Low-Pass Filter Designs
Let's look at two low-pass filters that don't use the Sallen & Key design. The two stages in Figure 15-12 use voltage-controlled voltage sources (VCVS), an approach differing from Sallen & Key only in that the op amps have gain.
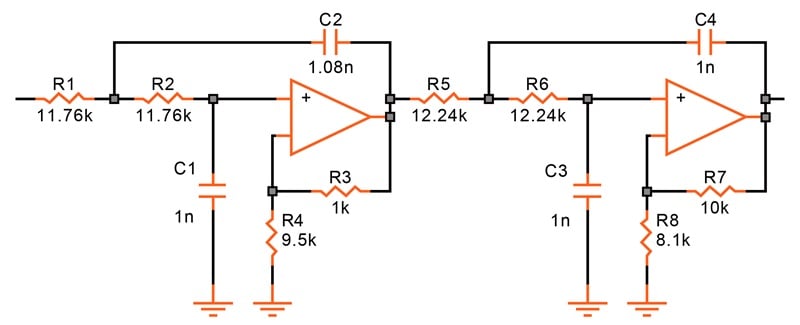
 Figure 15-12. Fourth-order low-pass Butterworth filter in a voltage-controlled voltage-source (VCVS) design.
Each stage of Figure 15-13 uses the Multiple Feedback technique.
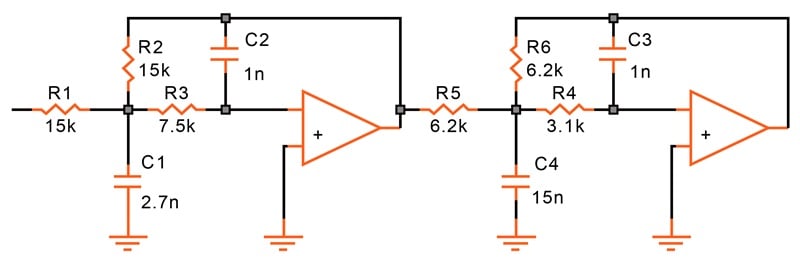
 Figure 15-13. A fourth-order Multiple Feedback approach.
All these different approaches render the same frequency and phase response, but they differ in sensitivity—in other words, how much component and op amp parameter variations will influence filter performance. A temperature and Monte Carlo analysis will reveal their respective merits.