Facebook
 Google
 GitHub
 Linkedin
Understanding the Temperature Coefficient of a Voltage Reference
How does temperature affect the output of a voltage reference? What is a temperature coefficient specification?
How does temperature affect the output of a voltage reference? What is a temperature coefficient specification?
Voltage references produce a stable voltage that’s ideally independent of changes in supply voltage, temperature, load, and other external factors. They are widely used in data converters, power supplies, measurement and control systems. The accuracy of such systems can be directly affected by the accuracy of the employed voltage reference.
There are several specifications that allow us to characterize the various aspects of a voltage reference accuracy. This article looks at the temperature coefficient (tempco) specification that characterizes the temperature-induced variations in the output of a voltage reference.
What Is a Temperature Coefficient Specification?
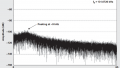
While the output of a voltage reference should be ideally independent of temperature, a real-world voltage reference exhibits temperature-induced variations in the output. Figure 1 below shows the output of LT1021-5. The nominal output voltage is 5 V but, as you can see, it’s not 100% independent of temperature.
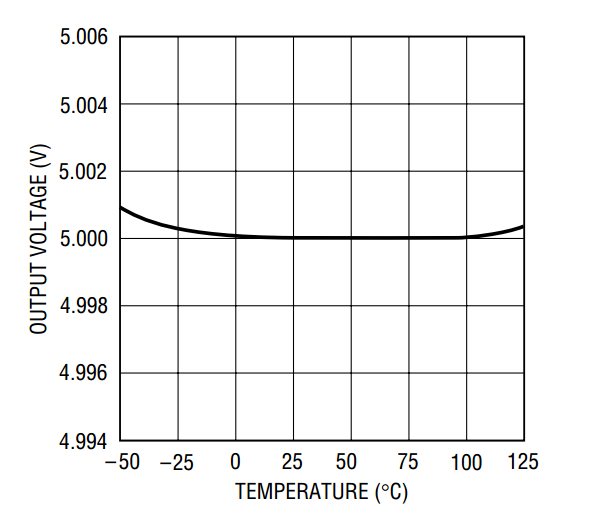
Figure 1. Image courtesy of Analog Devices.
The temperature coefficient (or temperature drift) of a voltage reference is the specification that characterizes the temperature-induced errors of the output. The common method (definition) is called “Box method” that uses the following equation:
$$TCV_{O} = \frac{V_{max} - V_{min}}{V_{nominal}(T_{max} - T_{min})} \times 10^{6}$$
This method considers the error over a specified temperature range (Tmax - Tmin). In this temperature range, the maximum and minimum of the output are subtracted to find the maximum variation in the output (Vmax - Vmin). The maximum output variation is divided by the temperature range multiplied by the nominal output value (Vnominal).
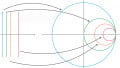
The result is multiplied by 106 to specify the tempco in ppm/°C (part per million /°C). Figure 2 below shows the upper and lower limits of the output voltage along with the temperature limits for the LT1021-5 voltage reference.
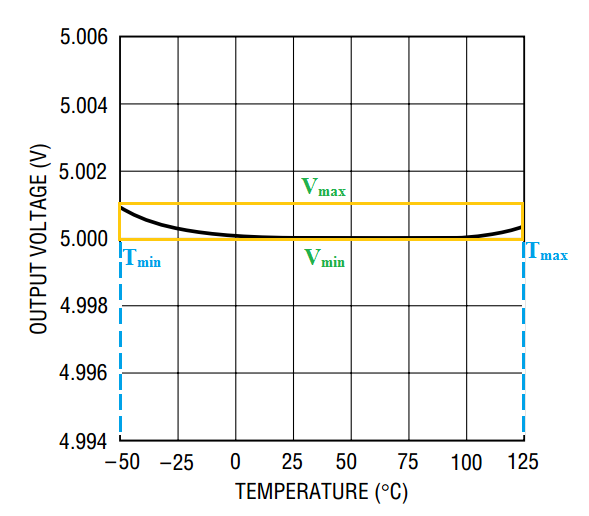
Figure 2
The boundaries form a box where the box diagonal is proportional to the tempco given by the above equation. As you can see, Vmax and Vmin are about 5.001 V and 5 V, respectively. Considering the temperature range from -50°C to 125°C, we obtain:
$$TCV_{O} = \frac{5.001 -5}{5 \big(125 - (-50) \big)} \times 10^{6} = 1.14 \; ppm/^{\circ} C$$
According to page 3 of the datasheet, the typical value for the LT1021-5 tempco is 2 ppm/°C. Note that Vmax and Vmin are not necessarily related to Tmax and Tmin. They just determine the maximum and minimum values of the output voltage in the temperature range from Tmin to Tmax.
The Drift Curve: Temperature Drift and Drift Error
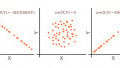
The tempco specification doesn’t give us the shape of the temperature-induced variations. Consider a voltage reference that has a nominal output of 5 V and a tempco of 1.14 ppm/°C. We saw that the LT1021-5 exhibits these specs (Figure 1); however, we can envision countless voltage references with these specs. Two hypothetical examples are shown in Figure 3 and 4.
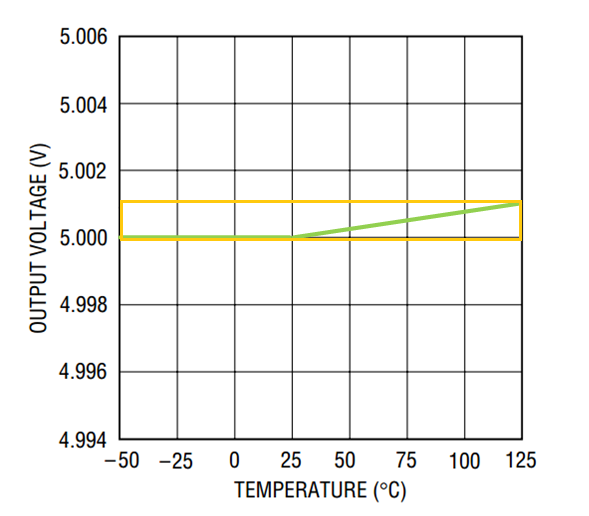
Figure 3
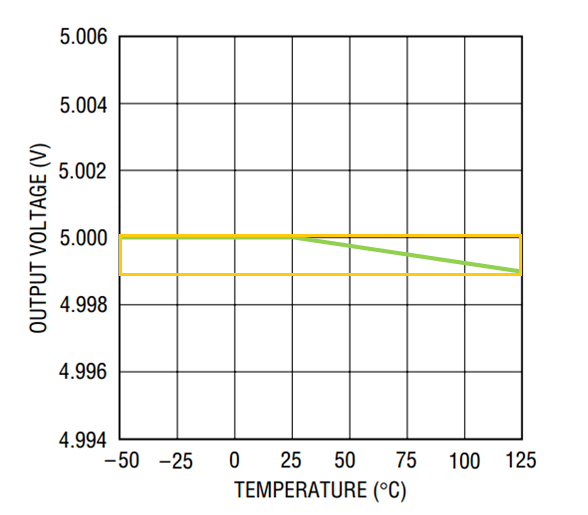
Figure 4
The unit of the tempco specification (ppm/°C) can mislead us to the wrong idea that the error is linear meaning that if we increase the temperature by 1°C, the output voltage will change by 1 ppm. However, we saw that tempco is defined in a way that doesn’t give us any information about the shape of the variations. It only gives us the maximum variation that we can expect in a specified temperature range.
Since the error is not linear, some manufacturers give the tempco of a device in more than one temperature range. For example, the MAX6025A is specified as a 20 ppm/°C device in the range -40°C to +85°C. However, in the range 0°C to +70°C, it exhibits a tempco of 15 ppm/°C. Hence, depending on the operating temperature range of an application, we can consider the MAX6025A as either a 20 ppm/°C or 15 ppm/°C device. Note that the tempco is given in a specified temperature range. We can use it to estimate the error only in the specified range. Estimating the error out of the specified range is inadvisable unless the temperature behavior of a given device is well understood.
How to Calculate the Temperature Coefficient
Let’s see how we can determine the required tempco for a system. As an example, assume that we have a 10-bit ADC and the voltage reference is used to set the ADC full-scale value. Suppose that we want the temperature-induced error to be less than half LSB of the system.
If we assume that the nominal output of the voltage reference is VFS, the LSB of our 10-bit system will be $$\frac{V_{FS}}{2^{10}}$$. Hence, the total variation of the voltage reference output should be less than $$\frac{V_{FS}}{2^{11}}$$. With a temperature range of -25°C to 75°C, we obtain:
$$TCV_{O} = \frac{\frac{V_{FS}}{2^{11}}}{V_{FS} \big(75 - (-25) \big)} \times 10^{6} = 4.88 \; ppm/^{\circ} C$$
Hence, we need a voltage reference with tempco less than 4.88 ppm/°C. For the above calculation, we only aimed to satisfy one condition: Keeping the total variation of the reference voltage below half LSB. With a tempco of 4.88 ppm/°C, we know that the total variation of the reference voltage is less than half LSB. What can we conclude about the absolute value of the reference voltage? We can consider two extreme cases:
- The minimum value of the reference voltage is its nominal value (VFS) and its maximum value is VFS + 0.5 LSB. In this case, the variation shape is similar to that depicted in Figure 3.
- The maximum value of the reference voltage is its nominal value (VFS) and its minimum value is VFS - 0.5 LSB. This case is similar to that depicted in Figure 4.
As you can see, a tempco of 4.88 ppm/°C guarantees that the variation is less than half LSB (regardless of the shape of the variations). However, depending on the voltage drift characteristics of a given device, the absolute value can be somewhere between VFS - 0.5 LSB to VFS + 0.5 LSB. Hence, if a particular application mandates keeping the absolute value below half LSB, we can simply choose a voltage reference that keeps the variation below ¼ LSB. The lower the drift, the more costly the product will be. Therefore, we need to consider the design requirements carefully to avoid overdesigning.
Moreover, note that Figures 3 and 4 depict hypothetical voltage drift characteristics. Many practical voltage references, especially the compensated bandgap devices, have an S-shaped curve (See Figure 5).
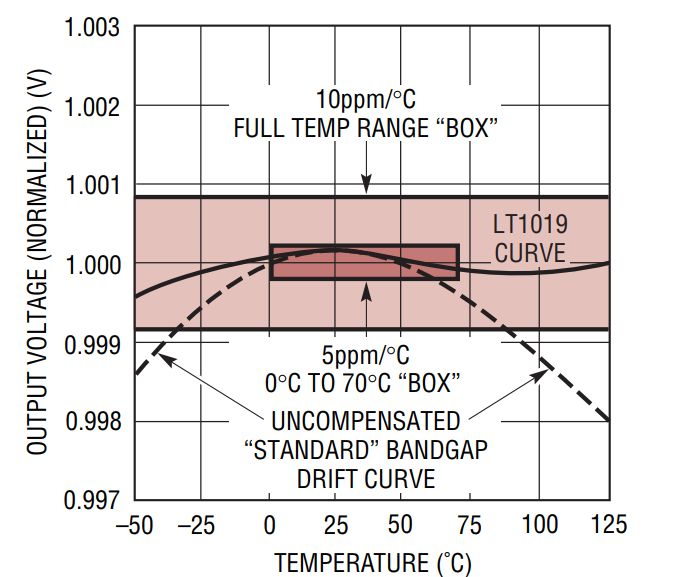
Figure 5 Image courtesy of Analog Devices.
Self-Heating of a Voltage Reference
The temperature range used to specify the tempco of a device refers to the die temperature. The power dissipated in a device can lead to a difference between the die temperature and the ambient temperature. In this case, we should estimate the die temperature and calculate the drift error based on the die temperature range. For more information, please refer to this application note from Maxim.
Review on the Basics of the Tempco of a Voltage Reference
Voltage references are widely used in data converters, power supplies, measurement and control systems. The temperature coefficient (tempco) of a voltage reference allows us to characterize the temperature-induced errors in the reference output.
The common method (definition) for calculating the temperature coefficient is the “Box method”. It’s important to note that the tempco specification doesn’t give us any information about the shape of the temperature-induced variations. It only allows us to calculate the maximum error that can occur in a specified temperature range.
Related Content