Facebook
 Google
 GitHub
 Linkedin
Boolean Relationships on Venn Diagrams
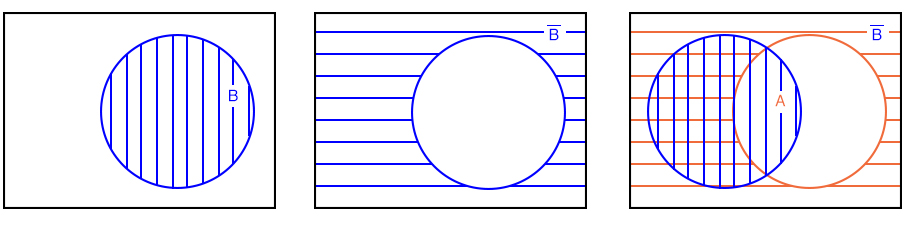
The fourth example has A partially overlapping B. Though, we will first look at the whole of all hatched area below, then later only the overlapping region. Let’s assign some Boolean expressions to the regions above as shown below.
Below left there is a red horizontal hatched area for A. There is a blue vertical hatched area for B. 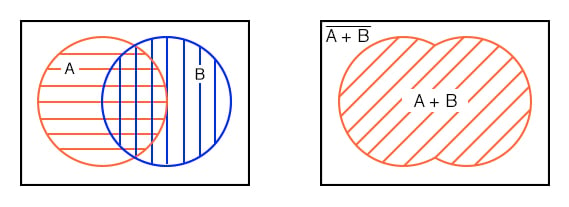
If we look at the whole area of both, regardless of the hatch style, the sum total of all hatched areas, we get the illustration above right which corresponds to the inclusive OR function of A, B. The Boolean expression is A+B.
This is shown by the 45o hatched area. Anything outside of the hatched area corresponds to (A+B)-not as shown above. Let’s move on to next part of the fourth example.
The other way of looking at a Venn diagram with overlapping circles is to look at just the part common to both A and B, the double hatched area below left. The Boolean expression for this common area corresponding to the AND function is AB as shown below right. Note that everything outside of double hatched AB is AB-not.
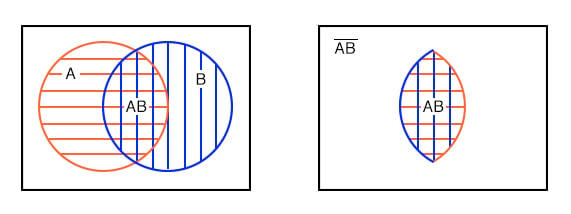
Note that some of the members of A, above, are members of (AB)’. Some of the members of B are members of (AB)’. But, none of the members of (AB)’ are within the doubly hatched area AB.
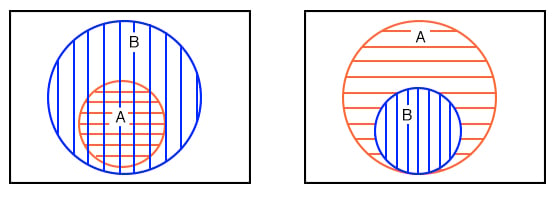
We have repeated the second example above left. Your fifth example, which you previously sketched, is provided above right for comparison. Later we will find the occasional element, or group of elements, totally contained within another group in a Karnaugh map.
Next, we show the development of a Boolean expression involving a complemented variable below.
Example: (above)
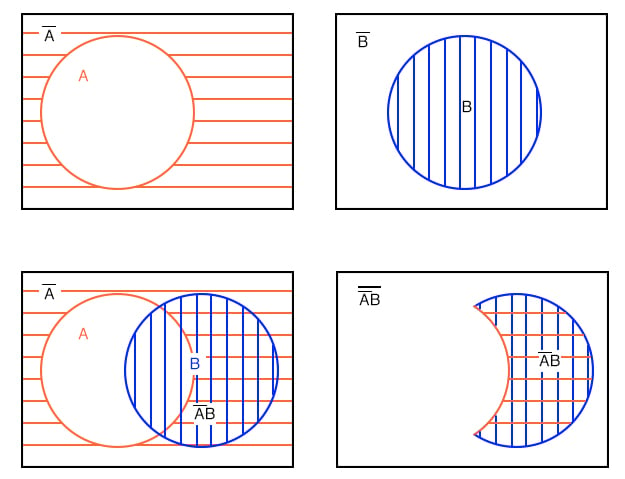
Show a Venn diagram for A’B (A-not AND B).
Solution: Starting above top left we have red horizontal shaded A’ (A-not), then, top right, B. Next, lower left, we form the AND function A’B by overlapping the two previous regions. Most people would use this as the answer to the example posed.
However, only the double hatched A’B is shown far right for clarity. The expression A’B is the region where both A’ and B overlap. The clear region outside of A’B is (A’B)’, which was not part of the posed example.
Let’s try something similar with the Boolean OR function.
Example: Find B’+A
Solution: Above right we start out with B which is complemented to B’. Finally we overlay A on top of B’. Since we are interested in forming the OR function, we will be looking for all hatched area regardless of hatch style. Thus, A+B’ is all hatched area above right. It is shown as a single hatch region below left for clarity.
Example: Find (A+B’)’
Solution:
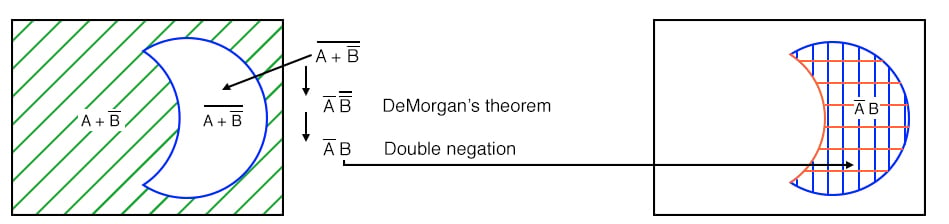
The green 45o A+B’ hatched area was the result of the previous example. Moving on to a to,(A+B’)’ ,the present example, above left, let us find the complement of A+B’, which is the white clear area above left corresponding to (A+B’)’.
Note that we have repeated, at right, the AB’ double hatched result from a previous example for comparison to our result. The regions corresponding to (A+B’)’ and AB’ above left and right respectively are identical. This can be proven with DeMorgan’s theorem and double negation.
This brings up a point. Venn diagrams don’t actually prove anything. Boolean algebra is needed for formal proofs. However, Venn diagrams can be used for verification and visualization. We have verified and visualized DeMorgan’s theorem with a Venn diagram.
Example:
What does the Boolean expression A’+B’ look like on a Venn Diagram?
Solution: above figure
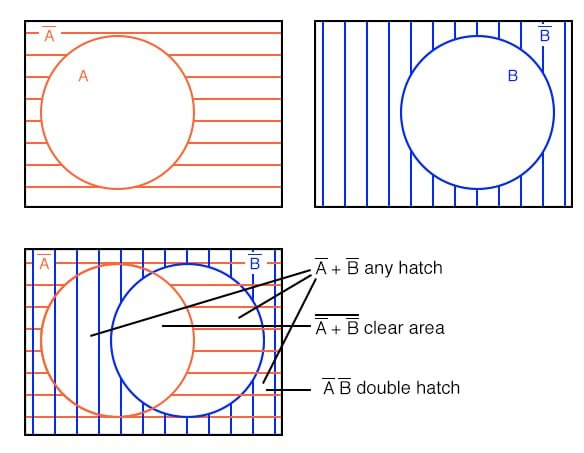
Start out with red horizontal hatched A’ and blue vertical hatched B’ above. Superimpose the diagrams as shown. We can still see the A’ red horizontal hatch superimposed on the other hatch. It also fills in what used to be part of the B (B-true) circle, but only that part of the B open circle not common to the A open circle.
If we only look at the B’ blue vertical hatch, it fills that part of the open A circle not common to B. Any region with any hatch at all, regardless of type, corresponds to A’+B’. That is, everything but the open white space in the center.
Example:
What does the Boolean expression (A’+B’)’ look like on a Venn Diagram?
Solution: above figure, lower left
Looking at the white open space in the center, it is everything NOT in the previous solution of A’+B’, which is (A’+B’)’.
Example: Show that (A’+B’)’ = AB
Solution: below figure, lower left
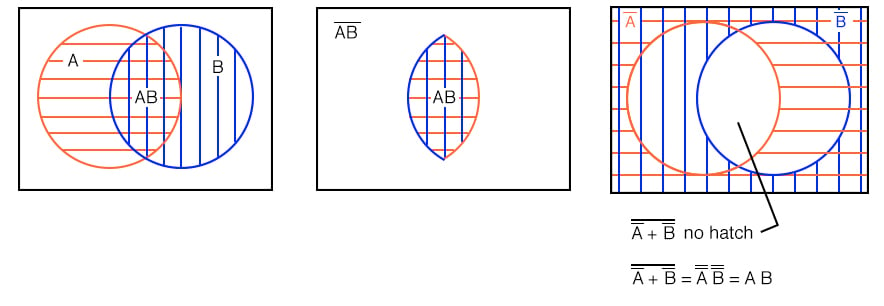
We previously showed on the above right diagram that the white open region is (A’+B’)’. On an earlier example we showed a doubly hatched region at the intersection (overlay) of AB. This is the left and middle figures repeated here.
Comparing the two Venn diagrams, we see that this open region , (A’+B’)’, is the same as the doubly hatched region AB (A AND B). We can also prove that (A’+B’)’=AB by DeMorgan’s theorem and double negation as shown above.
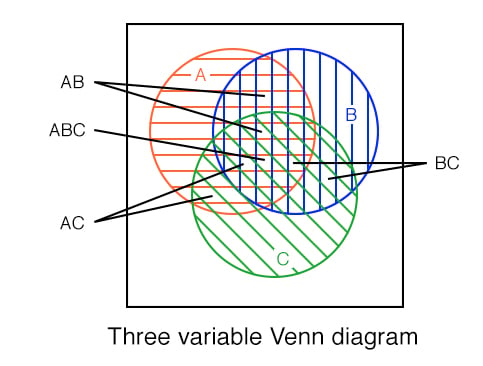
We show a three variable Venn diagram above with regions A (red horizontal), B (blue vertical), and, C (green 45o). In the very center note that all three regions overlap representing Boolean expression ABC.
There is also a larger petal shaped region where A and B overlap corresponding to Boolean expression AB. In a similar manner A and C overlap producing Boolean expression AC. And B and C overlap producing Boolean expression BC.
Looking at the size of regions described by AND expressions above, we see that region size varies with the number of variables in the associated AND expression.
- A, 1-variable is a large circular region.
- AB, 2-variable is a smaller petal shaped region.
- ABC, 3-variable is the smallest region.
- The more variables in the AND term, the smaller the region.