Facebook
 Google
 GitHub
 Linkedin
Making a Venn Diagram Look Like a Karnaugh Map
Starting with circle A in a rectangular A’ universe in figure (a) below, we morph a Venn diagram into almost a Karnaugh map.
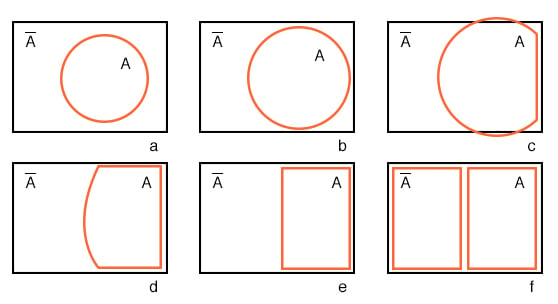
We expand circle A at (b) and (c), conform to the rectangular A’ universe at (d), and change A to a rectangle at (e). Anything left outside of A is A’ . We assign a rectangle to A’ at (f). Also, we do not use shading in Karnaugh maps. What we have so far resembles a 1-variable Karnaugh map, but is of little utility. We need multiple variables.
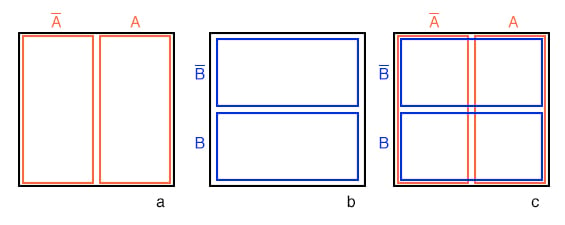
Figure (a) above is the same as the previous Venn diagram showing A and A’ above except that the labels A and A’ are above the diagram instead of inside the respective regions. Imagine that we have go through a process similar to figures (a-f) to get a “square Venn diagram” for B and B’ as we show in middle figure (b).
We will now superimpose the diagrams in Figures (a) and (b) to get the result at (c), just like we have been doing for Venn diagrams. The reason we do this is so that we may observe that which may be common to two overlapping regions—say where A overlaps B. The lower right cell in figure (c) corresponds to AB where A overlaps B.
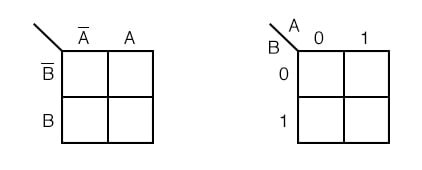
We don’t waste time drawing a Karnaugh map like (c) above, sketching a simplified version as above left instead. The column of two cells under A’ is understood to be associated with A’, and the heading A is associated with the column of cells under it. The row headed by B’ is associated with the cells to the right of it.
In a similar manner B is associated with the cells to the right of it. For the sake of simplicity, we do not delineate the various regions as clearly as with Venn diagrams.
The Karnaugh map above right is an alternate form used in most texts. The names of the variables are listed next to the diagonal line.
The A above the diagonal indicates that the variable A (and A’) is assigned to the columns. The 0 is a substitute for A’, and the 1 substitutes for A. The B below the diagonal is associated with the rows: 0 for B’, and 1 for B
Example:
Mark the cell corresponding to the Boolean expression AB in the Karnaugh map above with a 1
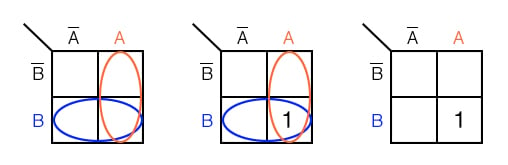
Solution:
Shade or circle the region corresponding to A. Then, shade or enclose the region corresponding to B. The overlap of the two regions is AB. Place a 1 in this cell. We do not necessarily enclose the A and B regions as at above left.
3-variable K-map
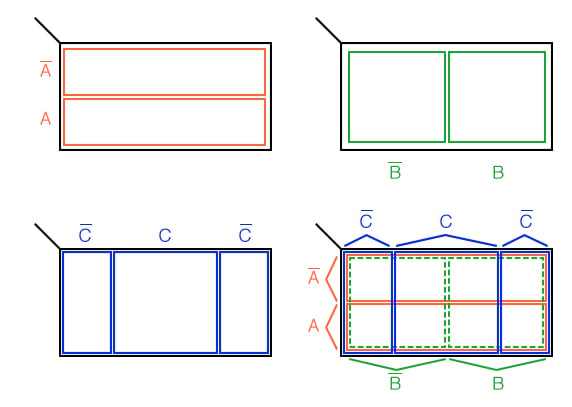
We develop a 3-variable Karnaugh map above, starting with Venn diagram like regions. The universe (inside the black rectangle) is split into two narrow narrow rectangular regions for A’ and A. The variables B’ and B divide the universe into two square regions. C occupies a square region in the middle of the rectangle, with C’ split into two vertical rectangles on each side of the C square.
In the final figure, we superimpose all three variables, attempting to clearly label the various regions. The regions are less obvious without color printing, more obvious when compared to the other three figures.
This 3-variable K-Map (Karnaugh map) has 23 = 8 cells, the small squares within the map. Each individual cell is uniquely identified by the three Boolean Variables (A, B, C). For example, ABC’ uniquely selects the lower right most cell(*), A’B’C’ selects the upper left most cell (x).
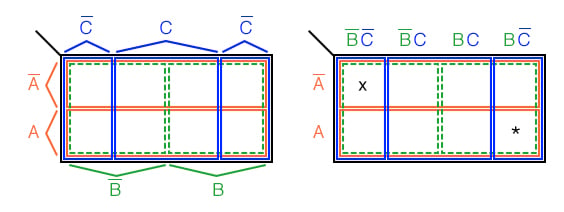
We don’t normally label the Karnaugh map as shown above left. Though this figure clearly shows map coverage by single boolean variables of a 4-cell region.
Karnaugh maps are labeled like the illustration at right. Each cell is still uniquely identified by a 3-variable product term, a Boolean AND expression. Take, for example, ABC’ following the A row across to the right and the BC’ column down, both intersecting at the lower right cell ABC’. See (*) above figure.
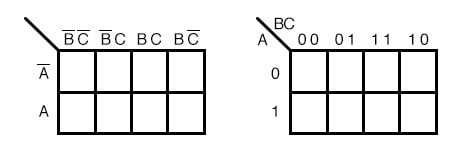
The above two different forms of a 3-variable Karnaugh map are equivalent, and is the final form that it takes. The version at right is a bit easier to use, since we do not have to write down so many boolean alphabetic headers and complement bars, just 1s and 0s Use the form of map on the right and look for the one at left in some texts. The column headers on the left B’C’, B’C, BC, BC’ are equivalent to 00, 01, 11, 10 on the right. The row headers A, A’ are equivalent to 0, 1 on the right map.