Facebook
 Google
 GitHub
 Linkedin
Understanding Simple Neural Network Training
In this article, we’ll review some important aspects of neural-net training, and then we’ll discuss the concept of overtraining.
New to neural networks? Start here or browse the rest of this series for more information:
- How to Perform Classification Using a Neural Network: What Is the Perceptron?
- How to Use a Simple Perceptron Neural Network Example to Classify Data
- How to Train a Basic Perceptron Neural Network
- Understanding Simple Neural Network Training
- An Introduction to Training Theory for Neural Networks
- Understanding Learning Rate in Neural Networks
- Advanced Machine Learning with the Multilayer Perceptron
- The Sigmoid Activation Function: Activation in Multilayer Perceptron Neural Networks
- How to Train a Multilayer Perceptron Neural Network
- Understanding Training Formulas and Backpropagation for Multilayer Perceptrons
- Neural Network Architecture for a Python Implementation
- How to Create a Multilayer Perceptron Neural Network in Python
- Signal Processing Using Neural Networks: Validation in Neural Network Design
- Training Datasets for Neural Networks: How to Train and Validate a Python Neural Network
Perceptron Training Data
The goal of training is to provide data that allow the neural network to converge upon a reliable mathematical relationship between input and output. In the previous article, the mathematical relationship was simple: If the x component of a point in three-dimensional space is less than zero, the output is zero (indicating, for example, that this data point is “invalid” and does not require further analysis); if the x component is equal to or greater than zero, the output is one (indicating a “valid” data point).
In cases such as this, where the mathematical relationship is known, you can generate training data in a spreadsheet program. I used Excel:

The x, y, and z components were produced by the RANDBETWEEN() function. In the screenshot shown above, the random values are all integers between –10 and +10. In another portion of the training set, I use the formula RANDBETWEEN(–10, 10)/10 to obtain non-integer x, y, and z components in the interval [–1, +1].

Just to be clear: Generating training data in a spreadsheet is a great way to experiment with neural networks, and experimentation is a very important part of becoming familiar and eventually proficient with neural-network design and implementation. However, in real applications you usually can’t manufacture training data in this way, because the whole point of using the neural net is to create an algorithm that you don’t already know and can’t easily define or ascertain.
The following subsections discuss some things to keep in mind when you’re creating a training set.
Provide an Abundance of Training Data
The neural network doesn’t learn through insight and critical thinking. It’s a purely mathematical system, and it approximates complex input–output relationships very gradually. Thus, large amounts of data help the network to continue refining its weights and thereby achieve greater overall efficacy.
Diversifying Your Data
It’s important to incorporate variety into your training data. We want the Perceptron to approximate the true, generalized relationship between input and output rather than a spurious or oversimplified relationship that exists between the input and output values of an insufficiently diverse training set.
Imagine that you’ve never seen a tree before and you have no idea what a tree looks like. Your friend is trying to help you out by showing you thousands of photographs of trees. Unfortunately, he lives in a pine forest, and he takes photos only of pine trees. After studying the photos, you can easily look at a pine tree, and probably also at a fir or a spruce, and say, “That is a tree.” However, what would you say if you saw an oak, or a sycamore, or a cherry tree, or a palm tree? This probably isn’t the best analogy that I’ve ever come up with, but I think it gives a general idea of what happens to a neutral network when you train it with data that don’t reflect the diversity of the real processing task.
Matching Training Data to Operational Data
The training data should be representative of the data that the network will attempt to categorize. The objective of training, after all, is to enable the network to effectively process some type of real-life information. For example, with regard to the simple classification system that we’ve been studying, I might know that my real-life input data will stay within the interval (–5, +5), perhaps because the three components of the input vector are actually analog voltages delivered by an op-amp with a ±5 V supply. If this were the case, I would produce a training set that includes numerous integer and non-integer values ranging from –5 to +5.
Shuffling
We saw in the previous article that a training set can be processed multiple times, with each complete pass through the set referred to as one epoch. However, it’s a good idea to shuffle the samples in a training set after each epoch, so that the network isn’t negatively affected by the order in which the samples are presented. I would probably implement this feature in the neural-net software, but you could also duplicate the training set in the spreadsheet and then randomly reorder the samples in the duplicated sets.
Overtraining
Neural networks can respond to extremely complex relationships between input and output, and consequently the network might incorporate input–output details that are specific to the training set and not relevant to the actual classification task. This is called overtraining (or overfitting).
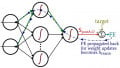
The following diagram effectively illustrates the concept of overtraining.

Image used courtesy of Ignacio Icke [CC BY-SA 4.0]
The red dots and blue dots represent training samples that the neural network is classifying. The black line represents a good classification strategy: it follows the general pattern that separates red from blue, and consequently it will probably produce the lowest error on real data. The green line is an overtrained classification strategy. It follows the training data too well; in its attempt to perfectly classify the training samples, it has created an input–output relationship that is less generalized and therefore less appropriate for real-life data.
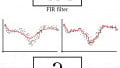
Another way to visualize overtraining is captured in the following plots.


In this case, we’re thinking of the neural network as a system that generates a mathematical function that serves as an approximation of the input–output relationship revealed by the training samples. Undertraining is clearly unacceptable, as the function does not accurately approximate the trend in the training data, but overtraining is also problematic because the trend is distorted by excessive attention to detail in the training set.
Conclusion
I hope that you know have a clearer idea about how to go about training a neural network. The next article will continue our discussion of training, but we’ll look at the issue from a more theoretical point of view.
Related Content