Facebook
 Google
 GitHub
 Linkedin
Characteristics of Junction Diodes
In this article, we will look at the characteristics of junction diodes and learn how to analyze circuits containing diodes that operate in the forward, reverse, and breakdown biases.
In this article, we will look at the characteristics of junction diodes and learn how to analyze circuits containing diodes that operate in the forward, reverse, and breakdown biases.
Junction Diode Characteristics
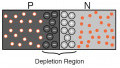
One of the most common applications of the diode is the pn junction. This pn junction can be used to operate and implement the functions of a diode because it can conduct considerable current in the forward direction and roughly no current in the reverse direction. In this article, we will focus on the i-v characteristics of the junction diode, specifically the pn junction.
Figure 1.1 illustrates the characteristics of a silicon junction diode. This same diode and its characteristics are shown in Figure 1.2 to illustrate more of the diode's properties. Looking at Figure 1.2, note that there is a discontinuity at the origin; this discontinuity is caused by having a change of scales from the reverse and forward voltage. The characteristic curve of the pn junction is made of three unique regions:
- The forward bias region - this is determined by v > 0
-
The reverse bias region - this is determined by v < 0
- The breakdown region - this is determined by v < -VZK
We'll learn about each of these regions, starting with the forward bias region.
Forward Bias Region
The forward bias region begins operation when the terminal voltage is positive. In this region, the i-v relationship can be characterized by:
$$i=I_{S}(e^{v/V_{T}}-1)$$
Equation 1.1
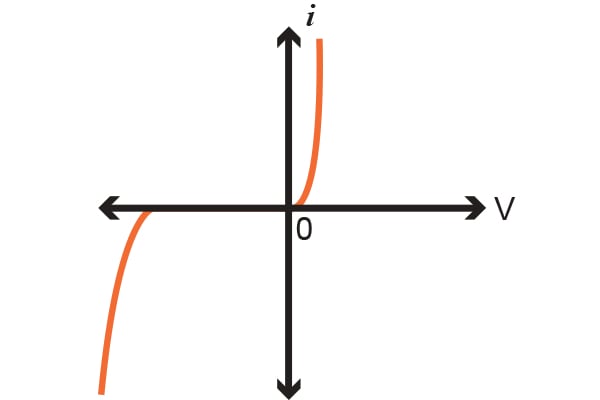
Figure 1.1 Characteristics of a silicon junction diode
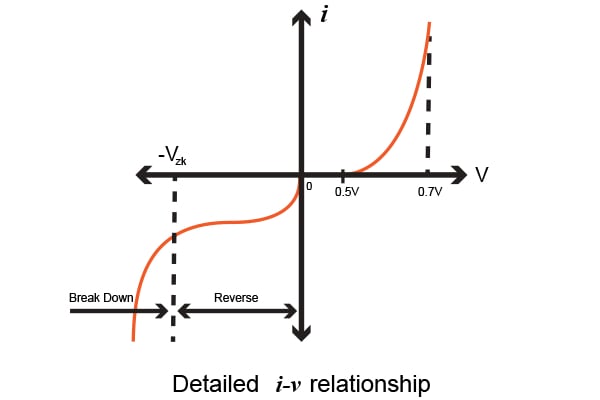
Figure 1.2 Details of the diode's relationship between current and voltage
In Equation 1.1, IS is a constant value that is given to a specific diode at a given temperature. This current, IS, is known as the saturation current. Alternatively, another name that is more commonly used is the scale current. This scale reference name arose from the current, IS, being directly proportional to the cross-sectional area of the given junction diode. With this in mind, if the area of the junction diode is doubled, the value of IS is consequently doubled.
As for small-signal diodes, which are very commonly used in electronic circuits where a high frequency or small current is required (such as televisions, radio, and digital logic circuits), Is is generally on the order of 10-15 Amps. The scale current is considered to be a strong function of temperature and doubles for every 5ºC rise in temperature.
If we look at Equation 1.1 again, the voltage, VT, is known as the thermal voltage, which is a constant given by:
$$V_{T}=\frac{kT}{q}$$
Equation 1.2
and
- k = Boltzmann's constant = 1.38•10-23 joules/kelvin
- T = Absolute temperature given in kelvins = 273.15 + temperature in ºC
- q = Electric charge magnitude = 1.60•10-19 coulombs
Then If we substitute the Boltzmann's constant into Equation 1.2, we get:
$$\frac{k}{q}=\frac{1.381\cdot^{-23}\frac{J}{K}}{1.602\cdot ^{-19}C}=86.2\frac{\mu V}{K}$$
Equation 1.2a
and since by definition 1 V = 1 J/C, we are provided with
$$V_{T}=(86.2\frac{\mu V}{K})T$$
If we consider room temperature (20ºC), Equation 1.2a provides a voltage value for VT of 25.3 mV.
If we look at the junction diode that operates in the forward direction with current i (more so for i >> IS), then Equation 1.1 can be estimated by an exponential relationship of the voltages:
$$i\simeq I_{S}e^{v/V_{T}}$$
Equation 1.3
This same equation can be written in a logarithmic form alternatively as
$$v=V_{T}ln\frac{i}{I_{S}}$$
Equation 1.4
This exponential relationship is an extraordinary characteristic of junction diodes and has been used to found many in many fascinating applications.
Looking now at the forward bias i-v relationship found in Equation 1.3, we can evaluate the current I1 that has a corresponding diode voltage of V1 to be
$$I_{1}=I_{S}e^{V_{1}/V_{T}}$$
Equivalently, if we have a diode voltage of V2, we will have a diode current of I2 given by
$$I_{2}=I_{S}e^{V_{2}/V_{T}}$$
Thus, we can combine these two equations to give
$$\frac{I_{2}}{I_{1}}= e^{(V_{2}-V_{1})/V_{T}}$$
which, by simplifying, provides
$$V_{2}-V_{1}=V_{T}ln\frac{I_{2}}{I_{1}}$$
Looking closely at Figure 1.2, we see that the current is rather small for v smaller than 0.5 v, which we consider to be negligible. This voltage value is referenced as the cut-in voltage. This is the definite forward voltage where the diode begins to conduct significantly. This threshold in the current-voltage characteristic is a consequence of the exponential relationship.
Another consequence of this relationships causes the rapid increase in the current i. Furthermore, for a diode that is said to be "fully conducting", the voltage drop is found in a rather narrow range, roughly 0.6 to 0.8 V. This provides a simple model for the diode as we assume that the conducting diode has a voltage of approximately 0.7 V across it. There are many different diodes which will exhibit this same 0.7 V drop, but at different current values. For example, if we consider a small-signal diode, a voltage drop of 0.7 V will be at i = 2 mA, while a larger power diode may have this same 0.7 V drop at i = 2 A.
Reverse Bias Region
This region begins its operation when the diode's voltage, v, goes to a negative value. The very first equation discussed in this article, Equation 1.1, illustrates that, if the voltage is negative and slightly larger than VT (~25.3 mV), then the exponential term, $$\frac{v}{V_{T}}$$, is trivial when compared to the whole. Thus the diode's current can be expressed as:
$$i\simeq -I_{S}$$
What this means is that, if the current is in the reverse direction, it is considered to be constant and equivalent to IS. Because this current is consistent, it earned the name "saturation current".
However, real diodes do exhibit these reverse currents and while they may be relatively small, are much larger than IS. For example, if we look at a small signal diode's saturation current that is said to be 10-14 to 10-15 A, it could exhibit a reverse current of 1 nA. This current will increase partially with the increase in magnitude of the reverse voltage. Due to the relatively small magnitude of the reverse current, it is not possible to see the current-voltage characteristic on Figure 1.2.
Breakdown Region
The last region of diode operation is known as the breakdown region, which is illustrated in Figure 1.2. This region is entered only when the magnitude of the reverse voltage surpasses a threshold value that is pertinent to the particular diode itself, known as the breakdown voltage. This is also known as the "knee" of the current-voltage curve in Figure 1.2, which is labeled as VZK, where Z denotes zener and K stands for knee.
As we look at the detailed figure illustrating the current-voltage characteristics, we see that the reverse current increases drastically in the breakdown region, while the voltage drop is rather small. A diode breakdown is typically not destructive, granted that the power that is dissipated within the diode is restricted by an external circuit at a safe level. This level is usually specified on the device or in the device's manual. Thus, it is necessary to restrict the reverse current in this breakdown region to a specific value that is consistent with the allowed power dissipation.
One more thing worth noting is that, because the current-voltage characteristic in the breakdown region is very close to a vertical line, we can use it in voltage regulation applications. We will discuss this in a separate article.
Conclusion
In this article, we discussed the three different regions of a junction diode and their characteristics. I hope that this article has helped you attain a better understanding of junction diodes. You should be able to differentiate between each region, as well as be able to explain what they are used for.
In the next article, we will delve more specifically into the forward direction and the constant-voltage-drop model. Building upon the previous articles in this series, we will now be able to talk about the analysis of circuits that utilize forward conduction diodes.
Thank you for reading. If you have any questions or comments, please leave them below!
Next Article in Series: Analysis of Forward Conducting Diodes