Facebook
 Google
 GitHub
 Linkedin
Exploring the Threshold Constraints of FM Demodulation Through Solved Examples
Working through examples shows how the threshold effect reshapes FM design choices. See how ignoring it can undershoot the required carrier power by over 5x for the same target SNR.
In FM systems, increasing the deviation ratio D improves output SNR or, equivalently, lowers the power needed to achieve a certain SNR. However, this gain comes at the expense of increased bandwidth usage. The threshold effect sets a fundamental limit on this trade-off, restricting how much bandwidth can be exchanged for power in FM. In this article, we’ll walk through solved examples to deepen our understanding of how the threshold effect influences FM system design.
Is Higher Deviation Ratio Always Better for FM SNR?
Figure 1 presents the output SNR versus baseband SNR γ for an FM waveform with single-tone modulation. Curves are provided for deviation ratios D = 2 and 5.
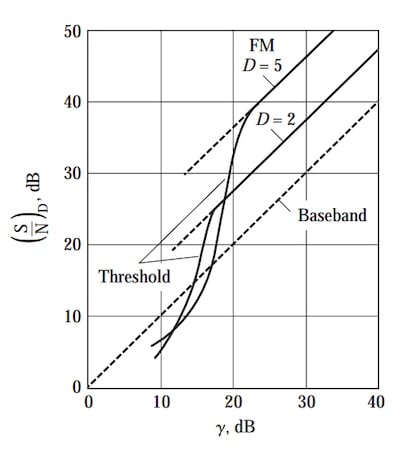
Figure 1. The output SNR versus baseband SNR for an FM signal modulated by a sinusoidal tone. Image used courtesy of A. Bruce Carlson
For reference, the baseband SNR is given by:
$$\gamma = \frac{A_c^2}{2N_0W}$$
Equation 1
where:
Ac denotes the carrier amplitude
W is the message bandwidth in hertz
N0 is the one-sided noise power spectral density (PSD).
Figure 1 shows that once the threshold is exceeded, FM systems achieve significant noise reduction. A higher deviation ratio D leads to a higher output SNR. This highlights the classic trade-off in FM between spectral efficiency and noise immunity, as increasing D inevitably demands greater bandwidth.
However, this trend doesn’t necessarily hold below the threshold. For example, at a baseband SNR of approximately 15 dB, increasing the deviation ratio from D = 2 to D = 5 results in a lower output SNR. This indicates that bandwidth cannot be exchanged indefinitely for SNR. An excessive deviation ratio may even degrade system performance.
Minimum Baseband SNR Required to Ensure Operation Above Threshold
Satisfactory operation of FM systems requires that operation be maintained above threshold. Deriving the deviation ratio associated with the threshold effect involves complex analysis and falls outside the scope of this article.
However, experimental observations show that occasional clicks occur in the FM receiver output when the carrier-to-noise ratio (CNR) is around 20 (or 13 dB). While Haykin’s Communication Systems proposes a threshold CNR of 20, some other references, such as Proakis’s Fundamentals of Communication Systems, recommend a lower value of 10 to avoid threshold-related degradation.
Using a threshold CNR of 10, we obtain:
$$\frac{A_c^2}{2 B_T N_0} \geq 10$$
Equation 2
Applying Carson’s rule, the FM signal bandwidth BT can be expressed in terms of the message bandwidth W as:
$$B_T = 2(D+1)W$$
Equation 3
Combining Equations 2 and 3, we have:
$$\underbrace{\frac{A_c^2}{2 N_0 W}}_{Baseband \ SNR} \geq 20(D+1)$$
Equation 4
The expression on the left-hand side is the baseband SNR. Therefore, the minimum acceptable value of the baseband SNR γmin is:
$$\gamma_{min} = 20(D+1)$$
Equation 5
Minimum Output SNR Required to Ensure Operation Above Threshold
From the derivation presented in a prior article on understanding noise in FM systems, the output SNR of the FM scheme can be expressed as:
$$SNR_{out} = 3 \times D^2 \times \gamma \times \underbrace{\frac{P_{m}}{(Max(|m(t)|))^2}}_{\text{Power of Normalized Message}}$$
Equation 6
Substituting the minimum acceptable baseband SNR γmin from Equation 5, we obtain the output SNR corresponding to the onset of the threshold effect:
$$SNR_{out} = 60 \times D^2 (D+1) \times \underbrace{\frac{P_{m}}{(Max(|m(t)|))^2}}_{\text{Power of Normalized Message}}$$
Equation 7
We’ll now walk through some illustrative examples to consolidate the preceding concepts.
Example 1: Determining Minimum FM Carrier Power
Consider an FM system with a message bandwidth of W = 10 kHz and a normalized message power of 0.5. If the noise affecting the system has a two-sided PSD of N0/2 = 10-8 W/Hz, what carrier power should be used to achieve an SNR of 40 dB at the output of the demodulator?
Solution
To gain insight, we begin by analyzing the system without accounting for the threshold effect. The applicable FM SNR expression, previously given in Equation 6, is reproduced below:
$$SNR_{out} = 3 \times D^2 \times \gamma \times \underbrace{\frac{P_{m}}{(Max(|m(t)|))^2}}_{\text{Power of Normalized Message}}$$
Equation 8
Substituting the specified values yields:
$$10^4 = 3 \times D^2 \times \gamma \times 0.5$$
Equation 9
Note that a 40 dB SNR translates to a numerical value of 104, which has been applied in the above calculations. As observed, for a fixed output SNR and normalized message power, increasing the deviation ratio D reduces the required baseband SNR γ.
According to Equation 1, when the message bandwidth W and noise spectral density N0 are held constant, the reduction in γ translates to a lower required carrier power Ac2/2.
Note that the channel bandwidth allocated to the FM signal is not specified in this example. Had the problem data included the channel bandwidth, we could apply Carson’s rule to determine the deviation ratio. This would reduce the above equation to a single unknown, the baseband SNR γ.
However, since the channel bandwidth is not specified, we’re left with two unknowns. To proceed, we assume a relatively large deviation ratio of D = 15, which helps lower the required carrier power. Inserting D = 15 into Equation 9 produces γ ≈ 29.6. Applying the baseband SNR equation, we have:
$$\frac{A_c^2}{2 N_0 W} = 29.6 \quad \Rightarrow \quad \frac{A_c^2}{2} = 29.6 \times 2 \times 10^{-8} \times 10 \times 10^{3} = 5.92 \ mW$$
Equation 10
According to Carson’s rule (Equation 3), increasing the deviation ratio expands the transmission bandwidth BT, thereby allowing more noise to enter the demodulator. When the noise power approaches the carrier power, the FM system enters the threshold region, resulting in a marked degradation of noise performance. Therefore, it’s necessary to verify whether the determined parameters ensure operation above the threshold.
Substituting D = 15 into Equation 5, the minimum acceptable value of the baseband SNR γmin is:
$$\gamma_{min} = 20(D+1) = 320$$
Equation 11
This value is greater than the computed baseband SNR (γ ≈ 29.6). This indicates that a deviation ratio of D = 15 cannot be used with a carrier power of 5.92 mW because this would lead to a noise power comparable with the carrier power. To avoid this, the deviation ratio should be increased only to the extent that above-threshold operation is still maintained.
Applying our values to Equation 7, we use the SNR equation corresponding to the onset of the threshold effect to find the appropriate value of the deviation ratio:
$$10^{4} = 60 \times D^2 (D+1) \times 0.5$$
Equation 12
A trial-and-error approach reveals that D = 6.6 is consistent with the preceding equation. In this case, the minimum acceptable value of the baseband SNR γmin works out to 20(D+1) = 20(6.6+1) = 152. Applying the baseband SNR equation, we have:
$$\frac{A_c^2}{2 N_0 W} = 152 \quad \Rightarrow \quad \frac{A_c^2}{2} = 152 \times 2 \times 10^{-8} \times 10 \times 10^{3} = 30.4 \ mW$$
Equation 13
This example demonstrates that a carrier power of 5.92 mW with D = 15 is insufficient. A higher carrier power of 30.4 mW and a reduced deviation ratio of D = 6.6 are required to avoid the threshold effect. In FM systems, the threshold effect limits the extent to which bandwidth efficiency can be sacrificed in favor of reduced power or improved noise performance.
Example 2: Determining Minimum Power Under Channel Bandwidth Constraint
In the preceding example, no constraint was placed on the channel bandwidth. We now revisit that case under the assumption of a 100 kHz channel bandwidth to examine how the parameter choices are affected. For convenience, the problem data are restated here: message bandwidth is 10 kHz, normalized message power is 0.5, N0 = 2×10⁻⁸ W/Hz, and the output SNR is 40 dB.
Solution
Since the channel bandwidth was unconstrained in the earlier example, we began by assigning a relatively large deviation ratio of D = 15. It later became evident that this value cannot be used due to the threshold effect. We can consider another scenario where the bandwidth needed for the above-threshold operation exceeds the available channel bandwidth, necessitating a further reduction in the deviation ratio.
In the earlier example, aiming for operation just above threshold gave us a deviation ratio of D = 6.6. Applying Carson’s rule, the bandwidth associated with D = 6.6 is:
$$B_T = 2(D+1)W = 2 \times (6.6+1) \times 10 \times 10^{3} = 152 \ kHz$$
Equation 14
The resulting bandwidth is greater than the 100 kHz channel bandwidth assumed in the problem data. Hence, we need to use a smaller deviation ratio compatible with the available bandwidth. We use Carson’s rule to find the proper value of the deviation ratio:
$$B_T = 2(D+1)W \Rightarrow 100 \ kHz = 2 \times (D+1) \times 10 \ kHz \Rightarrow D = 4$$
Equation 15
By applying D = 4 to the FM SNR formula (Equation 6), we obtain the corresponding baseband SNR:
$$10^{4} = 3 \times 4^2 \times \gamma \times 0.5 \Rightarrow \gamma = 416.6$$
Equation 16
Next, we use the baseband SNR equation to find the carrier power:
$$\frac{A_c^2}{2 N_0 W} = 416.6 \quad \Rightarrow \quad \frac{A_c^2}{2} = 416.6 \times 2 \times 10^{-8} \times 10 \times 10^{3} = 83.3 \ mW$$
Equation 17
Due to the bandwidth constraint, the deviation ratio must be reduced from D = 6.6 to D = 4, which in turn increases the required carrier power from 30.4 mW to 83.3 mW to maintain the same SNR.
While the above examples mostly emphasize system design, the third example below shifts slightly toward circuit-level aspects to help elucidate the ideas.
Example 3: Calculating Minimum Signal Level for an FM Signal Generator
An FM signal generator has an output resistance of RS = 300 Ω and noise temperature of TS = 290 K. This FM generator is used to test an FM demodulator with an input resistance of RM = 300 Ω and a noise temperature of TM = 250 K.
Determine the lowest signal level at the test generator necessary to ensure the FM demodulator remains above its threshold. Assume that the bandwidth of the FM wave is 200 kHz.
Solution
Figure 2 depicts the test setup’s block diagram, detailing the noisy demodulator and signal generator.
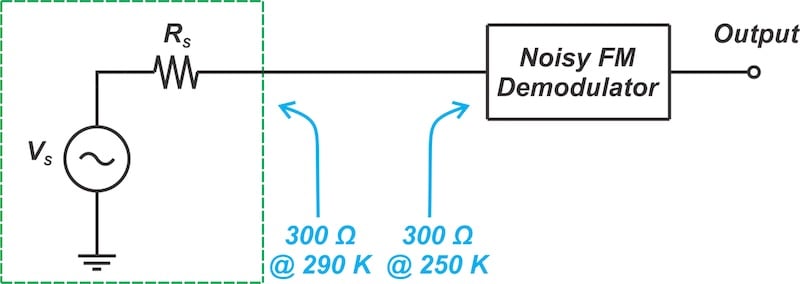
Figure 2. Block diagram of the FM signal generator test setup.
We can assume that the demodulator is noiseless and instead increase the initial temperature of Rs by TM = 250 K to account for the demodulator’s noise. This is illustrated below.
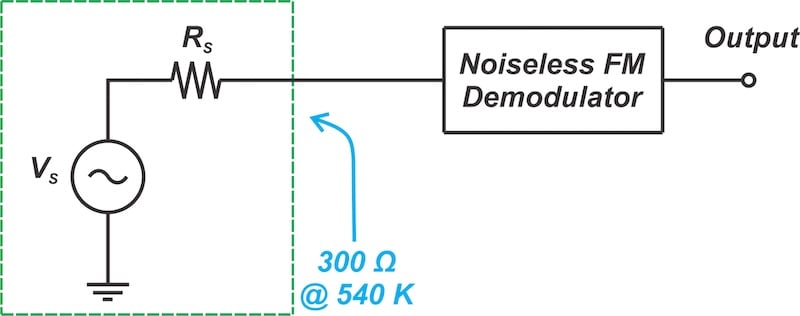
Figure 3. The equivalent model of the FM signal generator test setup used for noise calculations.
The available noise power of a resistor—that is, the noise power it can deliver to a matched resistor—is independent of its resistance value. The noise power is given by kTB, where:
k is Boltzmann’s constant (1.38 × 10⁻²³ joules per kelvin)
T is the temperature in kelvin
B is the bandwidth in hertz.
Therefore, the available noise power at the input of the demodulator is:
$$P_n = k TB = (1.38 \times 10^{-23}) \times (290+250) \times 200 \times 10^3 = 1.49 \times 10^{-15} \ W$$
Equation 18
Assuming a threshold CNR of 10, the minimum signal power is Ps = 1.49×10⁻¹⁴ W or -108.3 dBm. Since this power is delivered to a load resistance of 300 Ω, the carrier amplitude should be:
$$P_s = \frac{A_c^2}{2R} \Rightarrow A_c = \sqrt{1.49 \times 10^{-14} \times 2 \times 300} \approx 3 \ \mu V$$
Equation 19
Wrapping Up
In this article, we walked through solved examples that show how the threshold effect constrains the trade-off between bandwidth and power in FM systems. The next article will examine FM demodulator configurations that extend the threshold, such as the FM with feedback (FMFB) and phase-locked loop (PLL) demodulators.
Feature image background used courtesy of Adobe Stock.