 Facebook
 Google
 GitHub
 Linkedin
Introduction to Impedance Matching Using Transmission Line Elements
Learn about an impedance-matching technique using transmission line elements.
In a previous article in this series, we discussed how lumped components can be used to transform one impedance to another desired value. The frequency of application of lumped matching networks is normally limited to several gigahertz because, at high frequencies, the parasitic effects of lumped components become much more pronounced. There is another option, namely transmission line-based matching networks, that better suits high-frequency applications. In this article, we’ll explore this impedance-matching technique.
Transmission Line Input Reflection Coefficient
To better understand transmission line-based impedance matching, it’s important to understand how the input impedance and reflection coefficient change as we move along a transmission line terminated in a given load impedance ZL. Consider the following diagram in Figure 1.
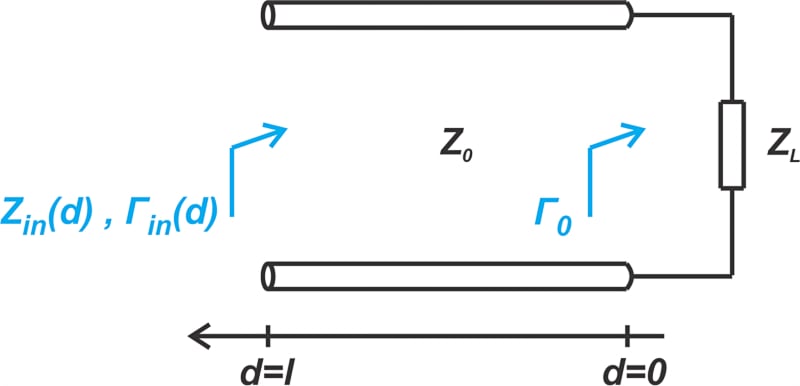
Figure 1. A diagram showing a transmission line of a load impedance and the reflection coefficient.
It can be shown that the reflection coefficient Γin(d) at a distance d from the load is given by:
\[\Gamma_{in}(d) = \Gamma_0 e^{-j2 \beta d}\]
Equation 1.
Where:
- β is the phase constant
- Γ0 is the load reflection coefficient
\[\Gamma_0 = \frac{Z_L - Z_0}{Z_L + Z_0}\]
Equation 2.
Equation 1 shows how the reflection coefficient changes along the line—the magnitude of Γin(d) is constant and equal to the magnitude of Γ0—however, its phase angle varies linearly with distance (d) from the load.
Next, let's take a look at an example.
Example 1: Find the Input Impedance and Reflection Coefficient
Find the input impedance and reflection coefficient of a 50 Ω line with βd = 71.585° terminated in a load impedance of ZL = 100 + j50 Ω.
By applying Equation 2, we first find the reflection coefficient at the load end:
\[\Gamma_0 = 0.4+j0.2 = 0.447 \measuredangle 26.57^{\circ}\]
Figure 2 locates Γ0 on the Smith chart (the normalizing impedance is Z0 = 50 Ω).

Figure 2. A Smith chart showing Γ0 and the normalizing impedance of Z0 = 50 Ω [click image to enlarge].
The βd parameter—known as the line’s electrical length—is 71.585° in this example. From Equation 1, the phase angle of Γin(d) is the phase of Γ0 minus 2 × 71.585 = 143.17°. Therefore, the phase angle of Γin(d) works out to 26.57° - 143.17° = -116.6°.
Figure 2 shows how a Smith chart can be used to graphically obtain Γin(d) from Γ0; for a given Γ0, the reflection coefficient along the transmission line Γin(d) lies on the circle having a radius of |Γ0|. In general, moving away from a termination on a transmission line produces a clockwise rotation along the constant |Γ| circle. A line with an electrical length of θ leads to a rotation of 2θ on the Smith chart.
Two Important Observations About Impedance and Transmission Lines
Consider a line with an electrical length of 180° (that corresponds to d = λ / 2). Such a line produces a full 360° rotation and moves us back to the original load impedance ZL where we started. This means that the impedance we observe along a transmission line repeats itself every half-wavelength.
Figure 2 also hints at an important property of transmission lines; a transmission line can move us from one constant-resistance circle to another. In the above example, a 71.585° long line moves us from the constant-resistance circle of r = 2 to the r = 0.5 circle. This means that a transmission line can act as an impedance-matching component. We’ll shortly return to this example and discuss transmission line-based impedance matching techniques in more detail, but before diving in too far, let’s first learn about the wavelength scale of the Smith chart.
Smith Chart Wavelength Scale
As discussed above, the input impedance of a transmission line can be found by a simple circular motion on the Smith chart. Rather than using the electrical length of the line, we can also characterize the line using its physical length, which is commonly expressed as a fraction of the wavelength.
The governing equation for this equivalence is \(βd = \frac{2πd}{λ}\). For example, βd values of 45°, 90°, 135°, and 180° can be respectively produced by physical lengths of:
- λ / 8
- 2λ / 8 = λ / 4
- 3λ / 8
- 4λ / 8 = λ / 2
That’s why Smith charts normally provide a wavelength scale along the perimeter of the chart, as shown in Figure 3.
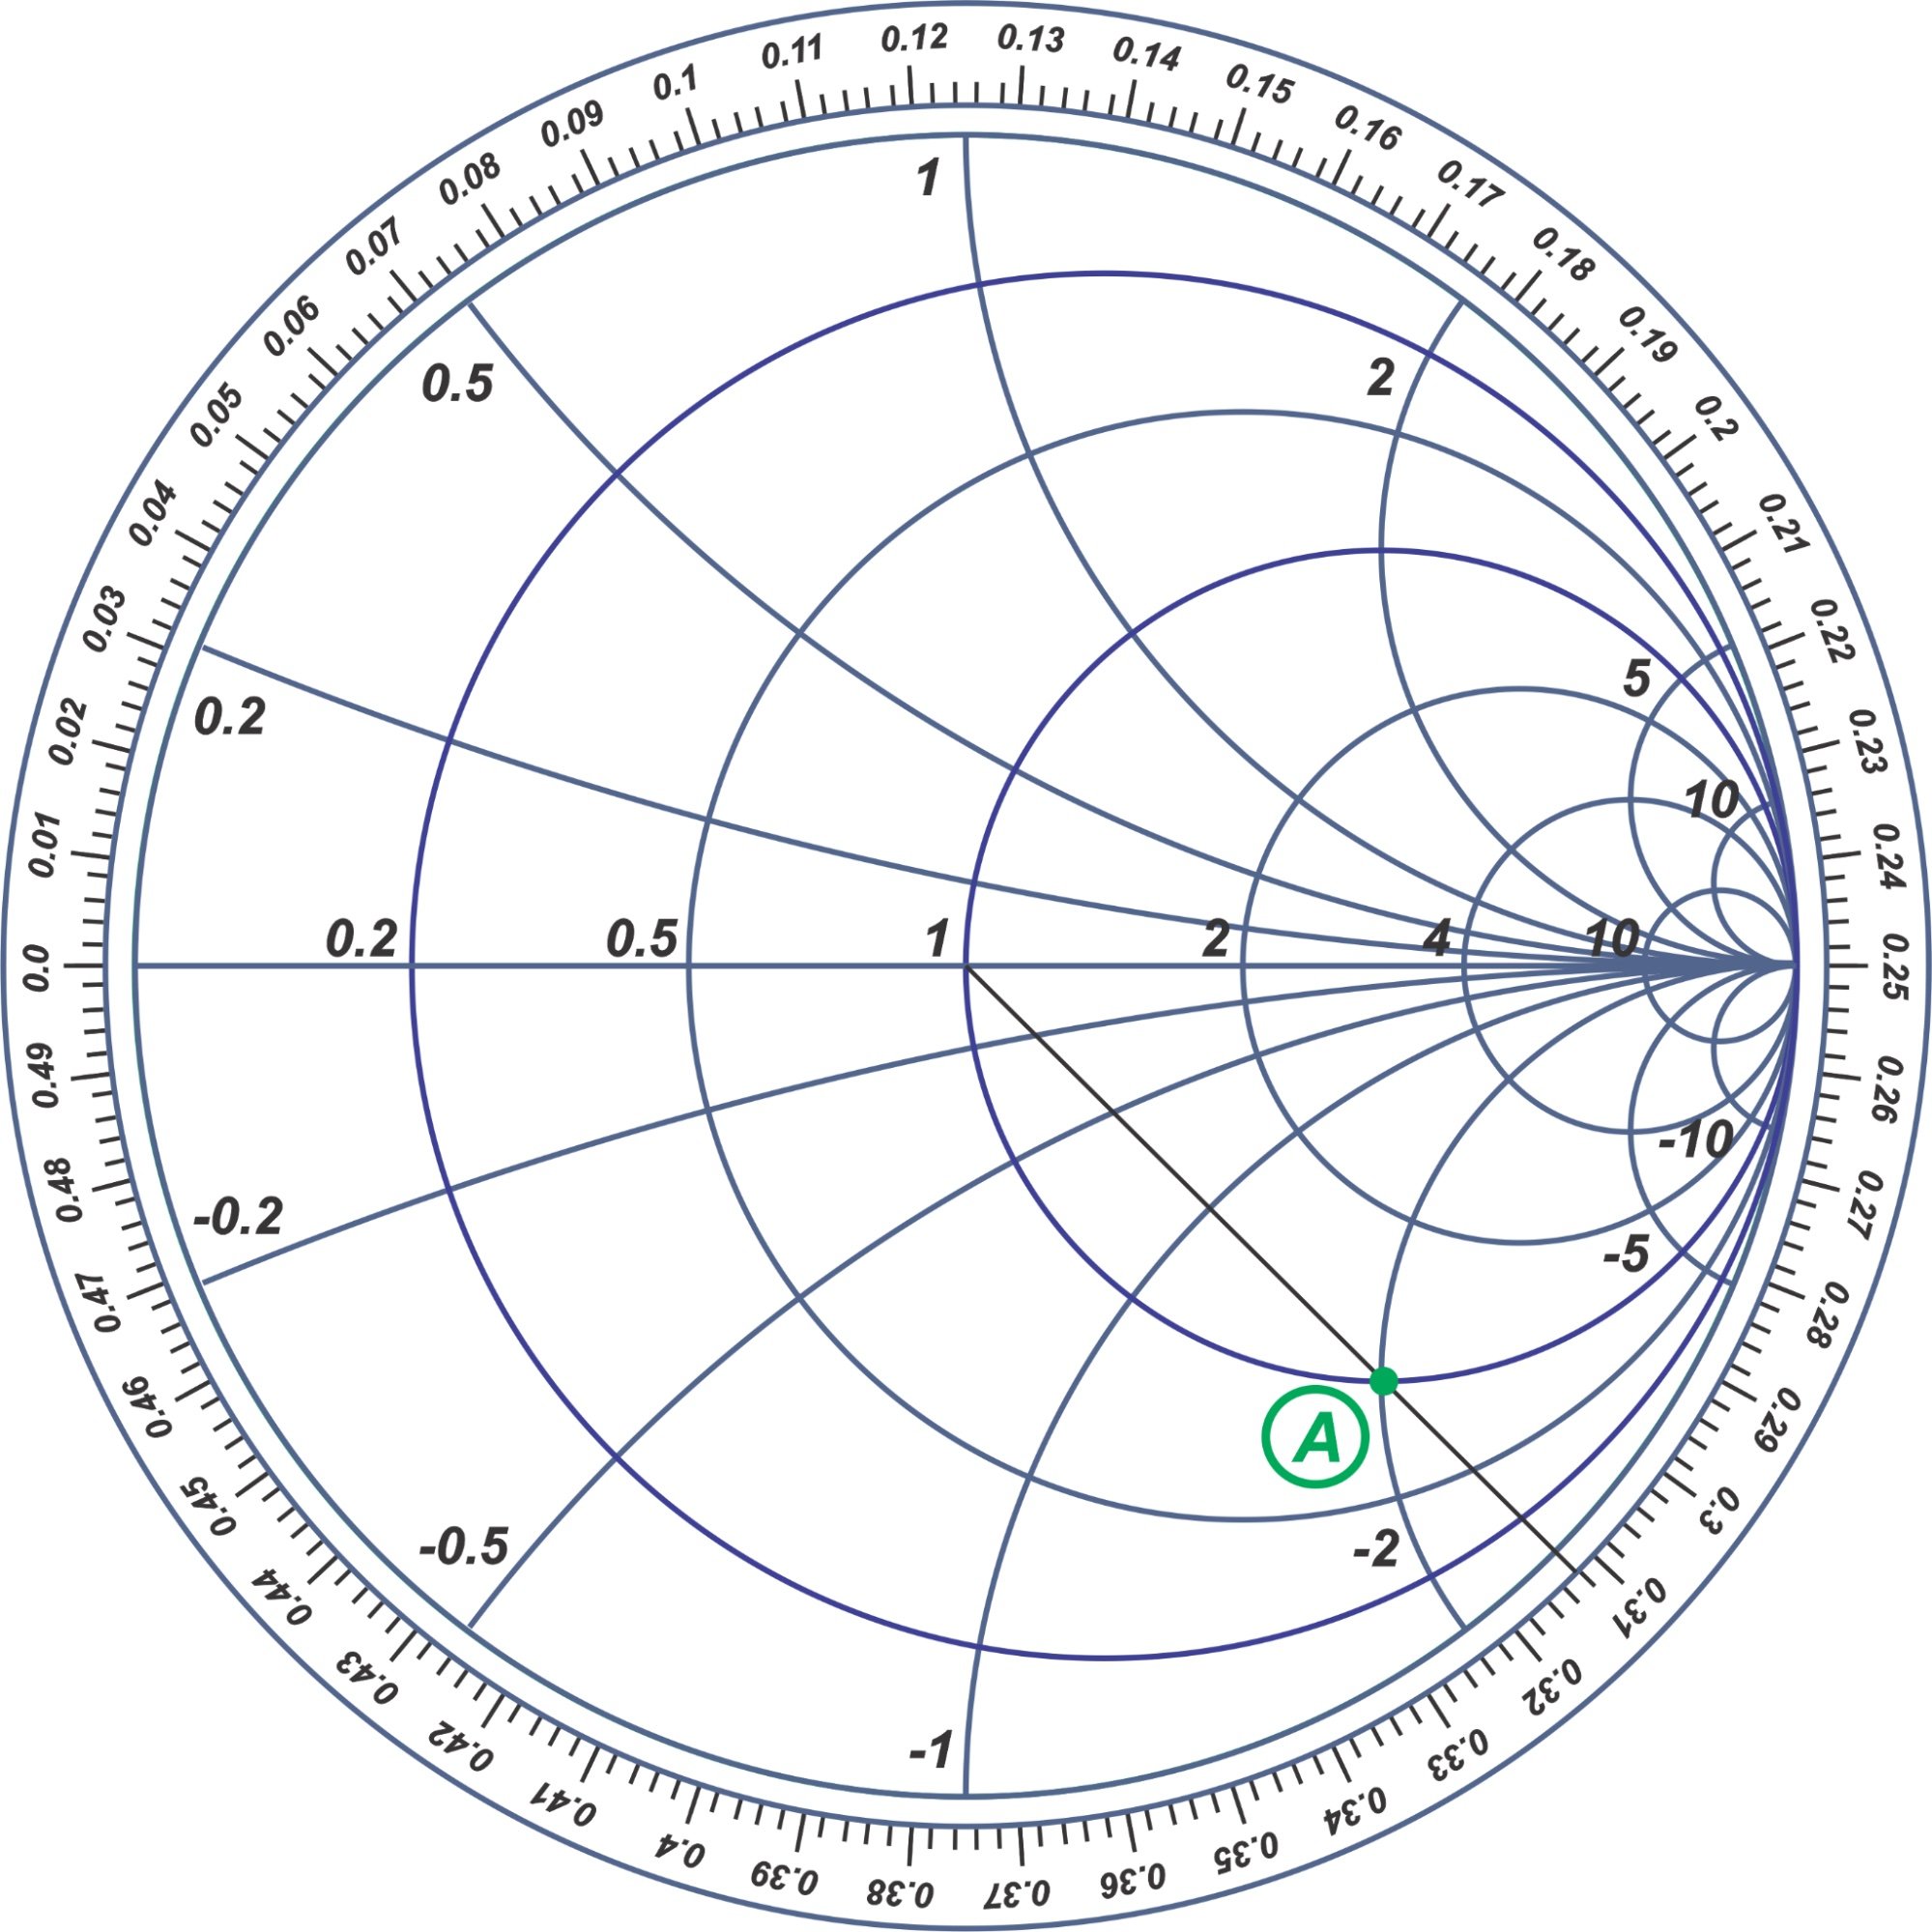
Figure 3. Example Smith chart with a wavelength scale around its perimeter [click image to enlarge].
The wavelength scale assigns a distance of d to each point on the Smith chart. For example, point A in the above figure corresponds to a distance of about 0.312λ. Note that the absolute value shown on the wavelength scale is not important; we just use this scale mainly to find the distance between two points on a transmission line in terms of the wavelength.
Below, we’ll look at an example to clarify how the wavelength scale is used to solve transmission line problems. Before we move on, note that since an electrical length of βd = 180° (corresponding to d = λ / 2) produces a full 360° rotation on the Smith chart, the wavelength scale of the Smith chart ranges from 0 to 0.5λ.
Example 2: Solving Transmission Line Issues Using the Wavelength Scale
Assume that at a distance of l1 = 0.051λ from a load impedance ZLoad, the input impedance is Z1 = 50 - j50 Ω (Figure 4 below).

Figure 4. Diagram showing the distances and load and input impedances of an example transmission line.
Find ZLoad as well as the input impedance Z2 at a distance of l2 = 0.074λ from Z1. Assume that the characteristic impedance of both lines is 50 Ω.
Using a normalizing impedance of 50 Ω, the normalized value of Z1 is found as z1 = 1 - j, which is located in the following Smith chart (Figure 5).
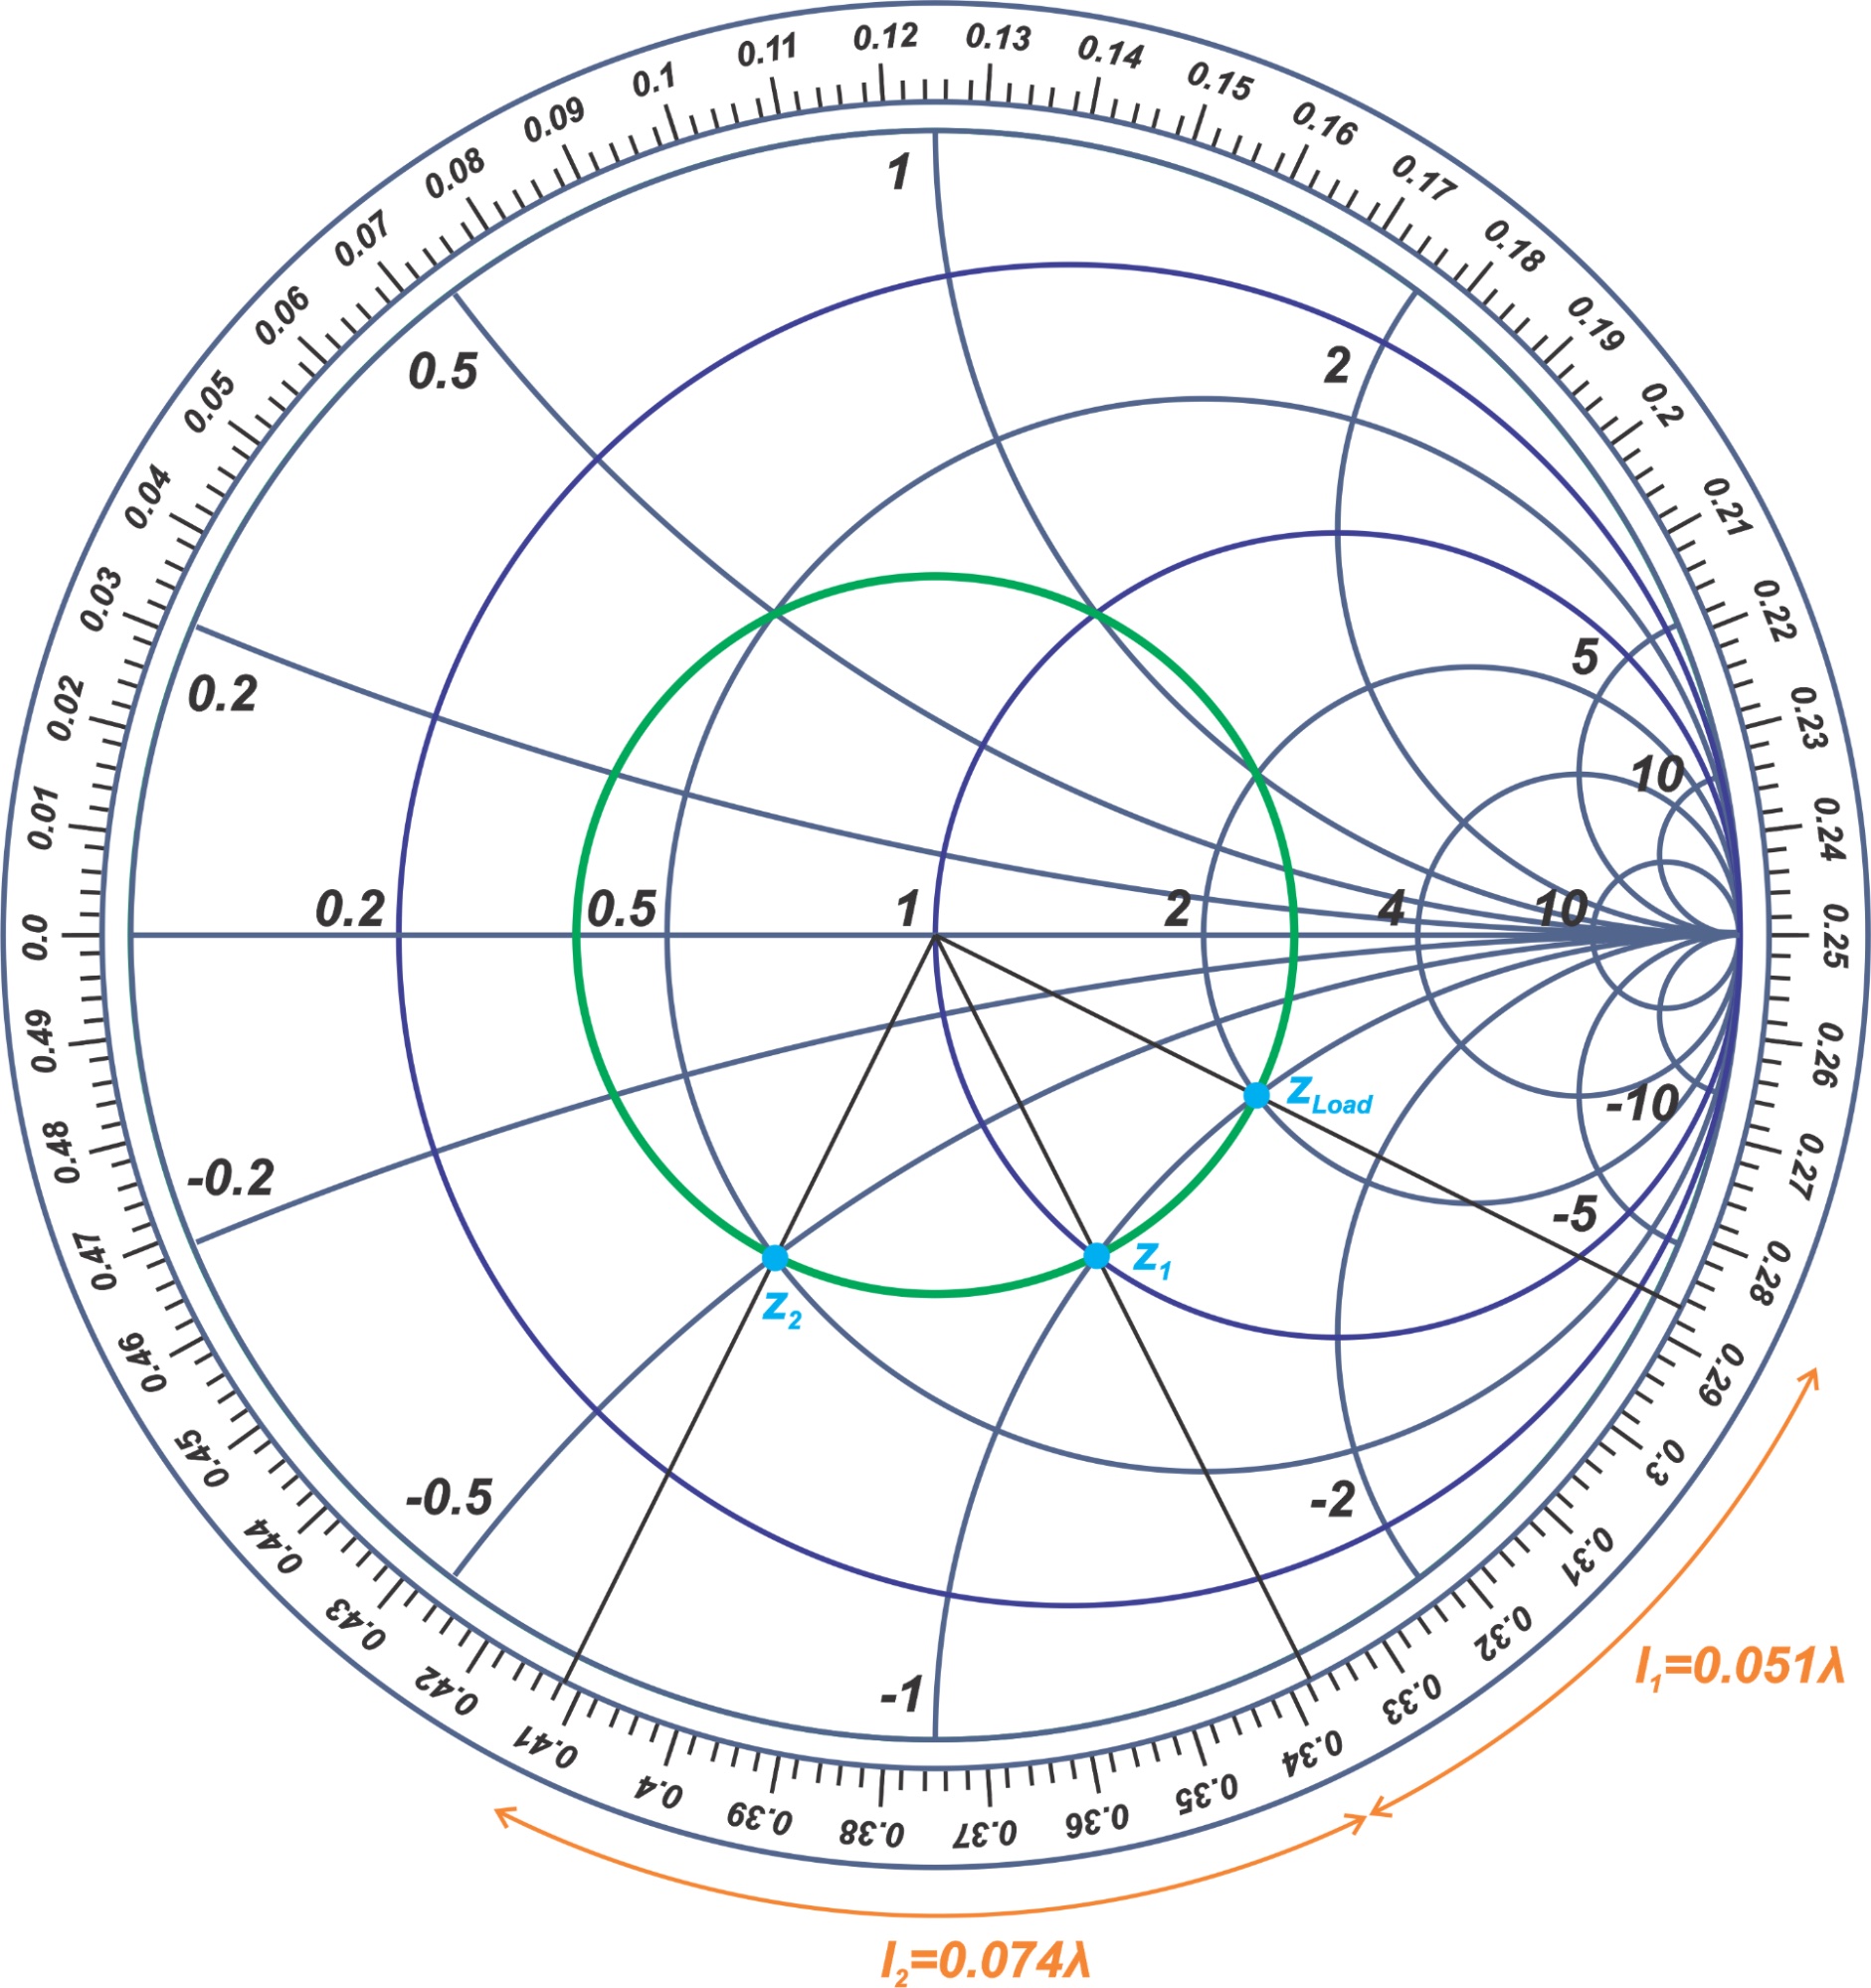
Figure 5. Smith chart showing the normalized impedance of 50 Ω [click image to enlarge].
We know that moving along a transmission line leads to a motion along a constant |Γ| circle on the Smith chart. We only need to determine the correct direction of motion. Keep in mind that moving away from a termination produces a clockwise rotation (with respect to the termination), and getting close to the termination leads to a counterclockwise rotation.
As shown in the above figure, z1 corresponds to about 0.338λ on the wavelength scale. For z2, we are moving away from zLoad by another 0.074λ. Therefore, z2 corresponds to 0.338λ + 0.074λ = 0.412λ on the wavelength scale, as illustrated in Figure 5. On the other hand, to locate zLoad, we should go in a counterclockwise direction, which leads us to the point corresponding to 0.338λ - 0.051λ = 0.287λ. From the Smith chart, we have ZLoad = 50 × zLoad = 100 - j50 Ω and Z2 = 50 × z2 = 25 - j25 Ω.
Example 3: Finding ZLoad and Z2
In the following diagram, we have Z1 = 50 - j50 Ω, l1 = 0.051λ, and l2 = 0.574λ. Find ZLoad and Z2.
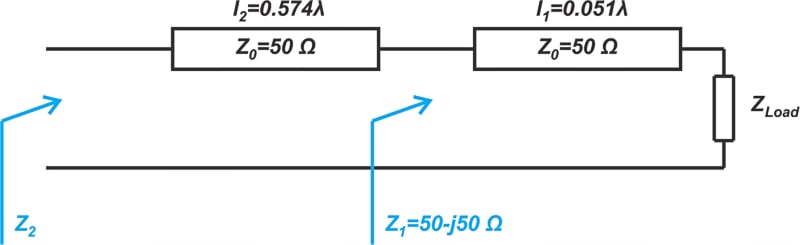
Figure 6. Diagram showing the need to find ZLoad and Z2.
Since the input impedance looking into a line repeats every half-wavelength, we can deduce that a 0.574λ line is equivalent to a 0.074λ line. Taking this into account and using the results of the previous example, we have ZLoad = 50 × zLoad = 100 - j50 Ω and Z2 = 50 × z2 = 25 - j25 Ω.
Wavelengths Toward Generator and Load Scales
Many textbooks, as well as commercial Smith charts, include two wavelength scales, one labeled “Wavelengths Toward Generator” and the other one “Wavelengths Toward Load” (Figure 7 below).

Figure 7. Example Smith chart showing the “Wavelengths Toward Generator” and the other one “Wavelengths Toward Load” labels [click image to enlarge].
The “Wavelengths Toward Generator” scale increases in a clockwise direction, whereas the “Wavelengths Toward Load” scale increases in a counterclockwise direction. The use of the “Generator” and “Load” terms can sometimes cause confusion. To avoid this type of confusion, keep in mind that the actual function of the termination—i.e. whether it is a source impedance —is not important. When we add a series transmission line to a termination, the input impedance and reflection coefficient of the line is found by a clockwise rotation on the Smith chart. On the other hand, when we reduce the length of the line and get closer to termination, the rotation is counterclockwise.
Transmission Lines as Impedance Matching Components
We’re now in a good position to introduce transmission line-based impedance matching that we alluded to in the previous sections. As an example, assume that we need to transform ZL = 100 + j50 Ω to 50 Ω. The load impedance ZL is actually the same as the value we used in Example 1 above. The Smith chart of Figure 2, with some additional details, is reproduced in Figure 9.
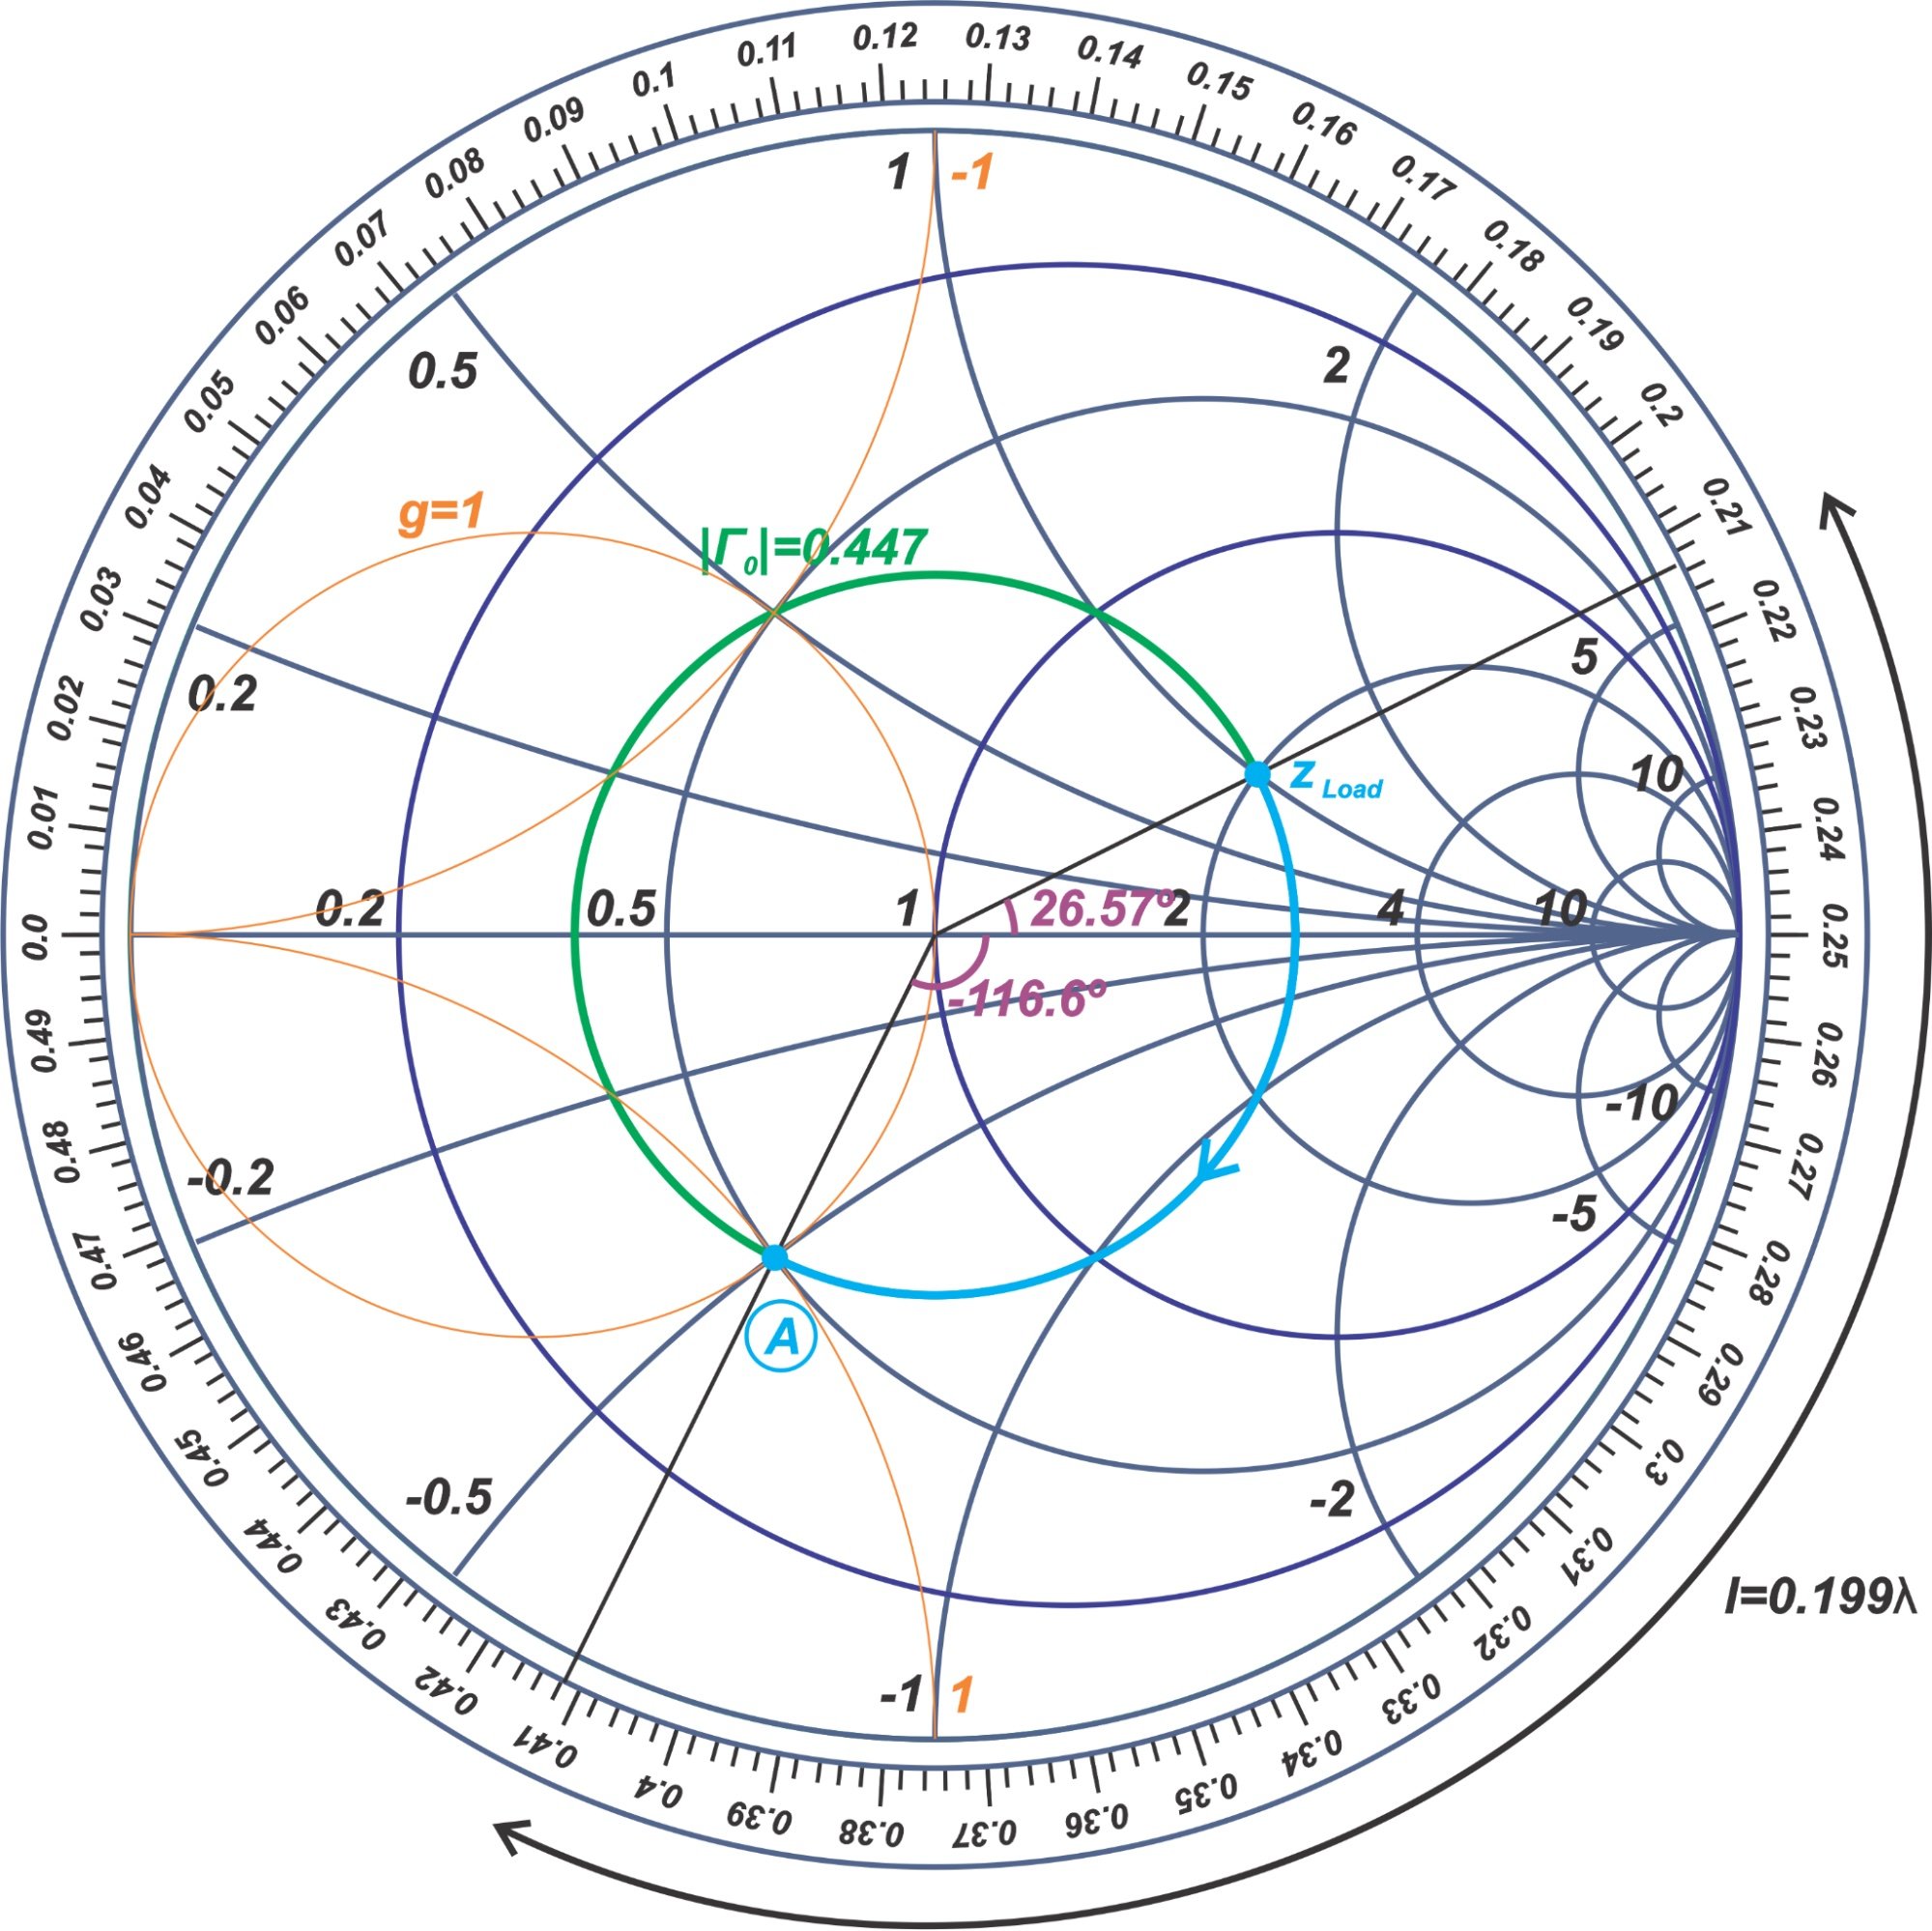
Figure 9. Smith chart from Figure 2 with additional details [click image to enlarge].
In this example, the length of the line is deliberately chosen in a way that moves us from the load impedance zLoad to point A, which is on the g = 1 constant-conductance circle. The electrical length of the line is 71.585° which corresponds to a length of 0.412λ - 0.213λ = 0.199λ (from the wavelength scale).
Since we’re on the g = 1 circle, we can add a parallel component with an appropriate susceptance to the line’s input and move along the g = 1 circle to the center of the Smith chart (Figure 10).
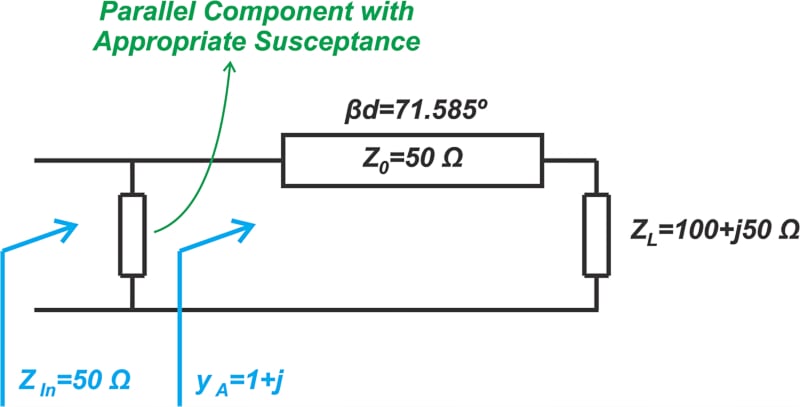
Figure 10. Diagram showing the addition of a parallel component.
From Figure 9, the normalized admittance at point A is found to be yA = 1 + j. We need a parallel element with a normalized susceptance of -j to arrive at the center of the Smith chart. One option is to use a parallel inductor. If the frequency of interest is 1 GHz, the inductor value is, as calculated below:
\[\frac{1}{L \omega Y_0}=1 \Rightarrow L=\frac{1}{2 \pi \times 1 \times 10^9 \times 0.02}= 7.96 \text{ } nH\]
Rather than using a lumped element, we can employ the impedance transformation property of transmission lines one more time. For example, a short-circuited line with an electrical length of 45°, which corresponds to a length of λ / 8, can produce the required normalized susceptance of -j. This is illustrated in Figure 11.

Figure 11. Smith chart showing the correspondence of 45° to produce the required normalized susceptance [click image to enlarge].
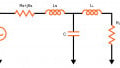
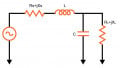
In the above figure, point B corresponds to a short-circuited load. A λ / 8 line produces a 90° clockwise rotation, moving us to point C that has a normalized admittance of -j, as required. The final matching circuits are shown in Figure 12.
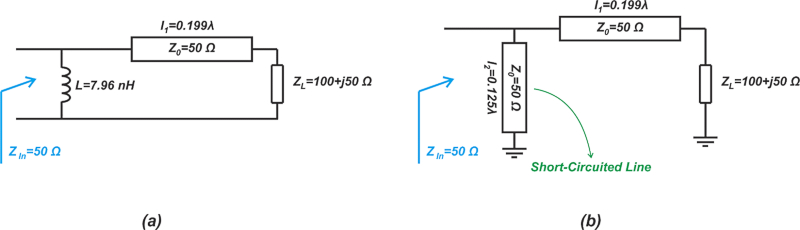
Figure 12. Circuit diagrams matching the outcome of Figure 11's Smith chart.
Transmission Line-based Impedance Matching Summary
Unlike lumped matching networks, transmission line-based impedance matching is better suited for high-frequency applications. A properly selected combination of a series line along with a parallel stub can transform an arbitrary impedance to another desired value. In this article, we introduced this technique through an example. In the next article, we’ll continue this topic and look at different methods of applying this technique.
To see a complete list of my articles, please visit this page.
Related Content


Can you please this RF matching tutorials in a series, like tutorial:1, tutorial:2, .... so on so that one can learn RF matching in a sequential way. Thank you.