Facebook
 Google
 GitHub
 Linkedin
Piezoelectric Accelerometers With Integrated Electronics Piezoelectric (IEPE)
Learn about piezoelectric accelerometers with integrated electronics piezoelectrics (IEPEs), namely an IEPE's voltage mode, charge mode, and dynamic range.
In a previous article, we discussed that amplifiers with high input impedance are required to successfully extract the acceleration information from a piezoelectric sensing element. With some piezoelectric accelerometers, the amplifier is built into the sensor housing.
The abbreviation IEPE, short for integrated electronics piezoelectric, is used to distinguish these piezoelectric sensors from those that don’t have built-in electronics. The output of an IEPE sensor is a low impedance voltage signal, whereas piezoelectric sensors that don’t have built-in electronics can only produce a charge output. The amplifier employed in an IEPE sensor can be a voltage amplifier or a charge amplifier.
In this article, we’ll use the term “voltage mode IEPE” to refer to an IEPE with a voltage amplifier, and the term “charge mode IEPE” for an IEPE sensor with an internal charge amplifier. We’ll also use the term “charge output sensor” to refer to a piezoelectric sensor that doesn’t have an internal amplifier.
Understanding Voltage Mode in an IEPE Accelerometer
To begin with, let's keep in mind a basic diagram of a voltage mode IEPE sensor, which is depicted in Figure 1.
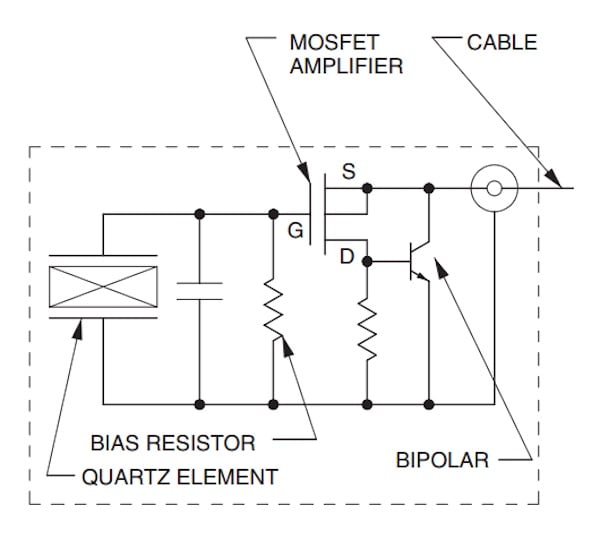
Figure 1. Example diagram of a voltage mode IEPE sensor. Image [adapted] used courtesy of Dytran
Keeping that figure in mind, let's dive into the sensing element, amplifier configuration, and discharge time constant for voltage mode IEPE.
The Sensing Element
While both quartz and piezo-ceramic crystals can be used in a voltage mode IEPE, quartz sensing elements are naturally better suited for voltage mode signal conditioning because they have lower capacitance and produce a larger voltage for a given amount of electric charge (according to V = q/C). Quartz is a natural crystal, whereas ceramics are man-made. Ceramics have both high voltage sensitivity and high charge sensitivity types. A piezo-ceramic with high voltage sensitivity can also be used in voltage mode IEPE sensors.
The Amplifier Configuration
As shown in Figure 1, the first stage of the amplifier incorporates a field-effect transistor (FET) to maximize the input resistance of the amplifier and avoid creating a leakage path for the charge produced by the sensor. At the output stage, the amplifier uses a bipolar transistor to improve line driving capability. In the above figure, the amplifier is a unity-gain source follower configuration. The source terminal of the transistor, as well as the circuit ground terminal, are brought out of the sensor housing to be connected to the power unit through a coaxial cable. The power unit of the IEPE sensors will be examined in another article.
The voltage that builds up across the sensing element (ΔV) is given by:
$$\Delta V=\frac{\Delta q}{C_{total}}$$
Where Δq denotes the produced electric charge and Ctotal is the total capacitance "seen" at the gate of the FET transistor. The same voltage change (ΔV) riding on top of a DC voltage also appears at the output of the unity-gain amplifier. The DC value of the output without excitation is typically in the 8 V to 12 V range.
The Discharge Time Constant
The charge produced by the sensor, which appears across the capacitor, can gradually leak off through the resistance “seen” at the gate of the FET transistor. The total resistance multiplied by the total capacitance at this node determines the discharge time constant.
As we discussed in previous articles about charge amplifiers, the discharge time constant determines the quasi-static behavior of the amplifier. Figure 2(b) shows how a limited time constant can introduce error when the input remains constant for a sufficiently long time (Figure 2(a)).
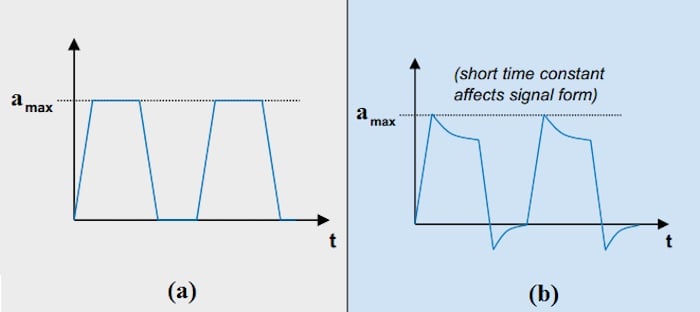
Figure 2. (a) Input acceleration waveform and (b) the output when the amplifier has a short time constant. Image (adapted) used courtesy of Kistler
Charge Mode IEPE Accelerometers
A charge mode IEPE uses an internal charge amplifier as shown in Figure 3.
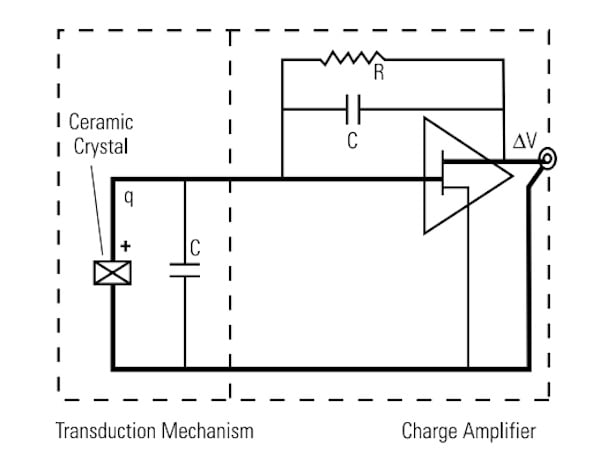
Figure 3. An example diagram of an internal amplifier in a charge mode IEPE. Image used courtesy of PCB Piezotronics
Charge mode IEPE accelerometers tend to be more common than the voltage mode type (to learn about the workings of charge amplifiers, please refer to the previous article that is linked at the beginning).
When compared to an equivalently proportioned ceramic element, quartz crystals typically have a higher voltage sensitivity and a lower charge sensitivity. The low charge sensitivity of quartz can limit its usefulness in charge mode IEPEs. This reason is why ceramic sensing elements are more commonly used in charge mode IEPEs.
Note that, just like the voltage mode IEPE, both the output signal and the supply voltage of the charge mode IEPE are brought out of the sensor through a standard coaxial or a two-conductor cable.
Dynamic Range of an IEPE Sensor
The DC value at the output of an IEPE sensor without excitation is typically in the 8 V to 12 V range. However, this DC voltage can change with temperature and the supply current provided by the power unit. The actual measured DC value of the output is reported on the calibration certificate supplied with each device. Figure 4 illustrates the dynamic range of a typical IEPE sensor.
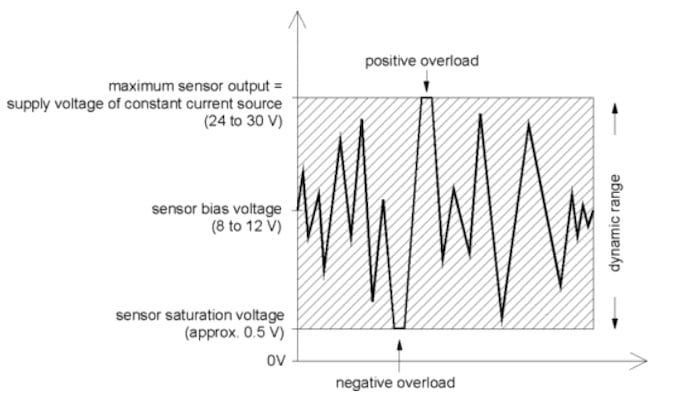
Figure 4. A graph showing the dynamic range of an IEPE sensor. Image used courtesy of MMF
The output voltage is always positive and the upper limit is determined by the supply voltage of the power unit. The lower limit, on the other hand, is determined by the amplifier parameters. Beyond this range, we’ll have a clipped waveform as shown in the figure above. Keep in mind that these voltage levels may differ from manufacturer to manufacturer.
Figure 5 shows the dynamic range of an example IEPE sensor from PCB Piezotronics for two different supply voltages (Vs1 = 24 VDC and Vs2 = 18 VDC).
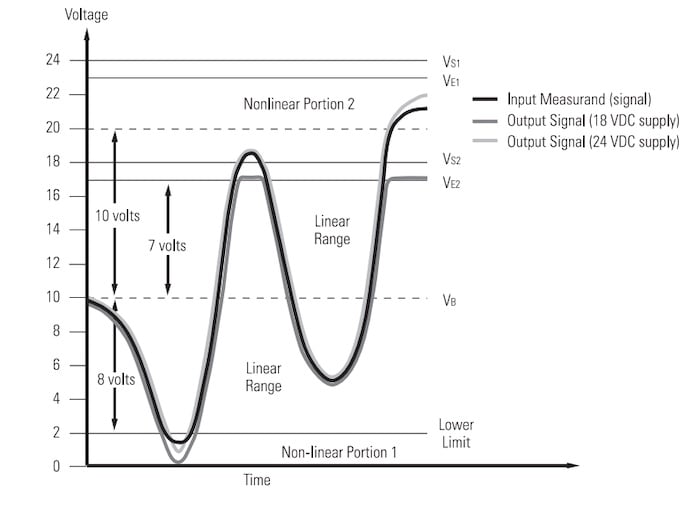
Figure 5. The dynamic ranges of an example IEPE sensor. Image used courtesy of PCB Piezotronics
In this figure, the solid curve represents the expected output, while the shaded curves represent the actual outputs for Vs1 = 24 VDC and Vs2 = 18 VDC. The DC value of the output is VB = 10 V in this example. The lower limit for this IEPE accelerometer from PCB is about 2 V. The upper limit for this sensor is 1 V lower than the employed supply voltage. This 1 V drop is required to keep the current limiting diode inside the power unit functioning correctly. The supply voltage of the PCB Piezotronics' IEPE sensors is generally within the range of 18 to 30 volts.
As shown in the figure, with a supply voltage of Vs2 = 18 V, the output is clipped at VE2 = 17 V. This can be solved by increasing the supply voltage to Vs1 = 24 V, giving an upper limit of VE1 = 23 V.
Maximum Swing Range Due to Linearity Limitations
It should be noted that the sensor might not be able to operate linearly all the way up to the positive rail. As shown in Figure 5, even with Vs1 = 24 V, the sensor deviates from the expected curve due to linearity limitations when the output gets close to the positive rail. To ensure that the sensor can produce accurate results, we need to take into account the specified maximum swing range of the device in addition to the swing limitation from the supply voltage.
An IEPE sensor typically has a maximum swing of ±3 V, ±5 V, or ±10 V. With the example shown in Figure 5, it is assumed that the sensor's maximum swing is ±10 V. That’s why the region 10 V higher than the bias voltage VB = 10 V is specified as the non-linear region. With Vs2 = 18 V, the maximum swing in the positive direction is limited to 8 V due to the supply voltage limitations. Increasing the supply voltage from 18 V to 24 V allows us to take full advantage of the maximum swing of the device and achieve a maximum positive swing of 10 V. The negative swing for both supply options, however, is determined by the 2 V lower limit, giving a maximum negative swing of 8 V for this example.
In the next article, we’ll look at the diagram of a typical power unit that can be used to supply power to an IEPE sensor. We’ll also look at the advantages and limitations of both the IEPE type and charge output sensors.
To see a complete list of my articles, please visit this page.
Related Content