Facebook
 Google
 GitHub
 Linkedin
FM Threshold-Extended Demodulators: Insights on FMFB and PLL-Based Designs
Worked examples quantify just how much the FMFB loop shrinks noise bandwidth. We also show how the PLL demodulator offers a simpler alternative for reducing threshold.
The previous articles in this series provided an in-depth exploration of the workings of the FMFB demodulator. In this article, we’ll use some solved examples to reinforce the concepts discussed in the previous articles and to offer insights into the typical threshold improvements provided by the FMFB configuration. Then, we’ll take a look at the PLL-based FM demodulator and its capability for threshold reduction.
FMFB Fundamentals
The basic block diagram of the FMFB demodulator is shown below.
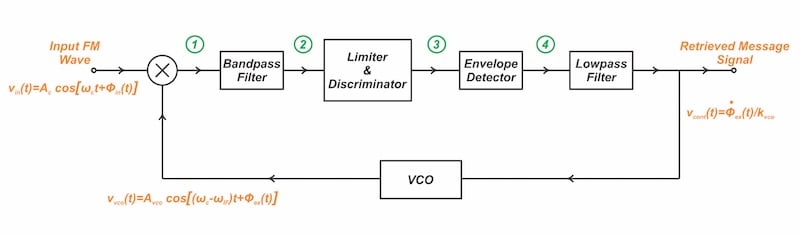
Figure 1. Functional block diagram of an FMFB demodulator
Consider the input FM signal represented as:
$$v_{in}(t) = A_c \ cos[\omega_c t + \phi_{in}(t)]$$
Equation 1.
where Ac is the amplitude of the input FM wave, ωc is the carrier frequency and ϕin(t) is the message-dependent phase term. Mathematical analysis reveals that the output of the FMFB demodulator is given by:
$$v_{cont}(t) = \frac{\alpha}{1 + \alpha \times k_{vco}} \times \frac{d}{dt}\phi_{in}(t)$$
Equation 2.
where ⍺ is the gain factor of the conventional demodulator incorporated in the forward path and kvco is the VCO gain factor measured in radians per second per volt (rad/sV). We observe that the VCO control voltage produces the output of the conventional demodulator—⍺ times the derivative of ϕin(t)—but attenuated by the factor 1 + ⍺kvco.
Furthermore, the analysis reveals that the feedback configuration decreases both the deviation ratio and IF filter bandwidth by a factor of 1 + ⍺kvco. This reduces noise at the discriminator input and lowers the FM detection threshold.
Example 1: Determining IF Filter Bandwidth in FMFB Demodulator
To demonstrate typical bandwidth reduction in FMFB systems, this example considers a tone-modulated FM wave as input. As shown in Figure 2, a carrier bandpass filter is assumed to precede the FMFB demodulator, serving to isolate the desired FM signal while suppressing adjacent-channel and out-of-band interference.
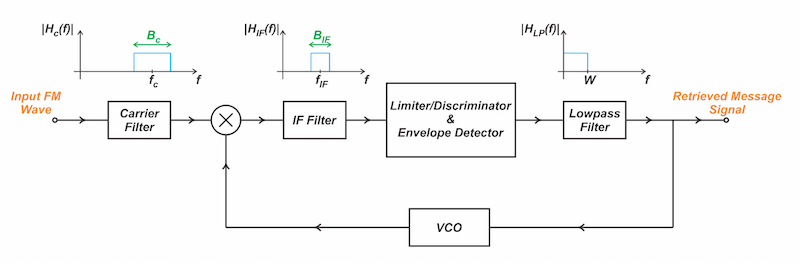
Figure 2. FMFB demodulator preceded by a carrier filter for input FM wave selection.
The carrier filter is centered at ωc and has a bandwidth of Bc. If the phase term of the input FM wave is ϕin(t) = β sin(ωmt) and the loop gain factor is ⍺kvco, develop a relationship between the bandwidth of the carrier filter Bc and that of the IF bandpass filter BIF. With β set to 10 and ⍺kvco set to 12, calculate the ratio of BIF to Bc.
Solution:
The bandwidths of the carrier and IF filters must be sufficiently wide to pass the FM wave without introducing distortion. Applying Carson’s rule, we establish a relationship between Bc and BIF, as follows:
$$\frac{B_{IF}}{B_c} = \frac{2(D_{IF}+1)W}{2(D_{c}+1)W} = \frac{D_{IF}+1}{D_{c}+1}$$
Equation 3.
where Dc and DIF represent the deviation ratios at the inputs of the carrier and IF filters, respectively. Note that the feedback configuration decreases the deviation ratio by a factor of 1+⍺kvco. In this example, the input deviation ratio is Dc = β, resulting in DIF = β/(1+⍺kvco). Therefore, Equation 3 simplifies to:
$$\frac{B_{IF}}{B_c} = \frac{\beta/(1+ \alpha k_{vco})+1}{\beta+1}$$
Equation 4.
Substituting β = 10 and ⍺kvco = 12, it follows that BIF = 0.16 Bc. Thus, the FMFB circuit successfully reduces the noise bandwidth at the discriminator input, which lowers the noise threshold for FM detection.
In practice, the IF filter often needs to be wider than that predicted by the above analysis to allow the FM wave to pass without distortion. Since the IF filter is part of a feedback loop, it usually must be a simple, low-order design to maintain system stability. Such low-order filters lack the sharp cutoff of an ideal filter, so a bandwidth broader than the above theoretical calculation is generally necessary.
Example 2: Estimating FMFB Threshold Reduction
Assume that the phase term of the FM wave applied to the FMFB demodulator is ϕin(t) = β sin(ωmt) and the loop gain factor is ⍺kvco. Develop a relationship for the noise threshold reduction when the bandwidths of the carrier filter and the IF bandpass filter are Bc and BIF, respectively. Next, assuming that ⍺kvco is much greater than unity, calculate the threshold improvements for modulation indices β = 5 and β = 10.
Solution:
Earlier in this series, we examined the threshold effect in the FM scheme in depth. For FM systems to operate effectively, it's essential to stay above the threshold level. While calculating the carrier power corresponding to the onset of the threshold effect can be analytically complex, experimental data suggests maintaining a carrier-to-noise ratio (CNR) of at least 10 to ensure reliable performance above the threshold. Therefore, we have:
$$\underbrace{\frac{A_c^2}{2 B_T N_0}}_{CNR} \geq 10$$
Equation 5.
where BT denotes the FM signal bandwidth, and N0 is the one-side power spectral density (PSD) of the channel noise affecting the communication system. For the purposes of this discussion, the carrier filter bandwidth Bc is assumed to be equal to the FM signal bandwidth BT.
Now let’s use the above information in the context of the FMFB demodulator. We note that if the in-phase and quadrature noise components at the output of the carrier filter have a two-sided power spectral density of N0 Watts/Hz over -Bc/2Bc/2, then the in-phase and quadrature noise components at the output of the IF filter retain the same spectral density N0, but over the reduced bandwidth -BIF/2BIF/2. This results in a reduction of the average noise power by a factor of Bc/BIF relative to the noise power at the output of the carrier filter.
Since the feedback mechanism effectively reduces the bandwidth of the noise entering the discriminator, the carrier power Ac2/2 can be scaled down by a factor Bc/BIF without causing the CNR at the input of the discriminator to drop below 10.
In other words, for a given transmission bandwidth BT and channel noise level, the FMFB configuration lets us reduce the carrier power Ac2/2 and consequently the threshold level by a factor Bc/BIF, which was calculated in the previous example (Equation 4).
For ⍺kvco much greater than unity, the ratio Bc/BIF simplifies to:
$$\frac{B_c}{B_{IF}} = \frac{\beta+1}{\beta/(1+ \alpha k_{vco})+1} \approx \beta+1$$
Equation 6.
With modulation indices of β = 5 and β = 10, the FMFB configuration is expected to reduce the threshold by approximately 7.8 dB and 10.4 dB, respectively. Note that the simplified analysis presented here is intended to offer insight into the threshold reduction potential of the FMFB configuration. In practical applications, the FMFB demodulator typically achieves a threshold extension of about 5 to 7 dB, which is a significant improvement in the design of low-power FM systems.
FMFB Demodulator Acting as a Tracking Filter
Note that the operation of the FMFB demodulator leverages a key piece of a priori information: although the FM wave’s instantaneous frequency spans a wide range, its rate of change is relatively slow, determined by the characteristics of the underlying message signal.
The FMFB demodulator functions as a tracking filter, following the slowly varying instantaneous frequency of the input FM wave. The FMFB tracking filter has a narrow passband and hence, only a narrow band of noise around the input instantaneous frequency enters the circuit. In other words, as the feedback loop continuously tracks the input frequency, the discriminator encounters a narrow band of noise centered around the VCO frequency.
PLL-Based FM Demodulator
The PLL-based demodulator, shown in Figure 3 below, is another commonly used FM demodulator that can reduce the noise threshold.
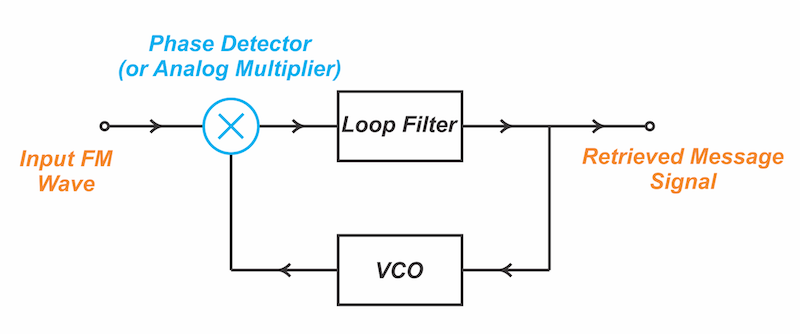
Figure 3. Basic block diagram of a PLL used for FM demodulation.
A PLL comprises three key components: a phase detector, a lowpass filter, and a VCO, arranged in a feedback loop. The phase detector, which can be implemented using an analog multiplier, compares the phases of the input FM signal and the VCO output, generating a signal that reflects the phase difference between them. This signal is filtered to create the VCO's control voltage.
If the VCO output leads the PLL input, the control voltage slows the VCO phase; if it lags, the control voltage advances the VCO phase. Therefore, the PLL forces the VCO output phase to follow that of the input FM wave, except for a fixed phase difference of 90 degrees that arises when using a multiplier-type phase detector.
To understand how the PLL performs FM demodulation, note that the instantaneous output frequency of the VCO is given by:
$$\omega_{vco}(t) = \omega_0 + k_{vco} v_{cont}(t)$$
Equation 7.
where ω0 is the VCO free-running frequency. Using Equation 7, the VCO’s frequency shift from its free-running frequency is proportional to its control voltage.
On the other hand, we understand that, in FM systems, the frequency deviation is proportional to the message signal. Therefore, Equation 7 shows that the VCO generates an FM wave, with the control voltage acting as the message signal.
Due to the feedback employed in the PLL, the VCO output is forced to follow the input FM wave, which means the VCO’s control voltage must vary in accordance with the underlying message signal. For a more in-depth explanation of how the PLL accomplishes FM demodulation, please refer to this article.
FMFB vs. PLL-Based FM Demodulators
Exploring the threshold extension feature of the PLL demodulator falls outside the scope of this article. Nevertheless, a brief discussion of some fundamental features of this demodulator in comparison to the FMFB configuration is warranted. Figure 4 presents the PLL demodulator with some additional details.
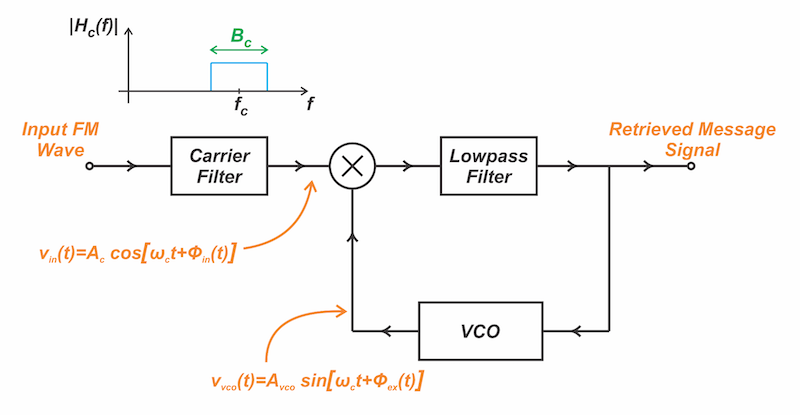
Figure 4. PLL demodulator highlighting signals at critical nodes.
Three key points merit attention:
1 - Although both FMFB and PLL demodulators include a VCO in the feedback loop's return path, their free-running frequencies differ. The FMFB demodulator uses a VCO whose free-running frequency is ωc-ωIF, where ωIF is the center frequency of the bandpass filter following the mixer. In contrast, the PLL demodulator employs a VCO with a free-running frequency equal to the carrier frequency of the input FM wave ωc.
2 - When the input FM wave is expressed as a cosine function (see Equation 1), the VCO output in the FMFB configuration similarly assumes a cosine form, as illustrated in the following equation:
$$v_{vco}(t) = A_{vco} \ cos[(\omega_c - \omega_{IF})t + \phi_{ex}(t)]$$
Equation 8.
However, the VCO output in the PLL configuration takes the form of a sine function:
$$v_{vco}(t) = A_{vco} \ sin[\omega_c t + \phi_{ex}(t)]$$
Equation 9.
This indicates a fixed phase difference of 90 degrees between the inputs that arises when using a multiplier-type phase detector.
3 - Similar to the FMFB demodulator, the PLL operates as a narrowband tracking filter. As the loop follows the instantaneous frequency of the input FM wave, the PLL is exposed to a narrow band of noise centered around the VCO's output frequency. This lets the PLL demodulator reduce the noise threshold. Analytical estimation of the PLL’s threshold extension is complex and signal-dependent. In practice, however, most implementations achieve an improvement of 2 to 3 dB. While this falls short of the FMFB demodulator’s performance, the PLL offers threshold enhancement with a simpler circuit design.
Wrapping Up
The threshold effect places an upper limit on the trade-off between bandwidth and power in an FM system. This means that the deviation ratio cannot be increased indefinitely to reduce the transmitted power. Beyond a certain point, performance deteriorates due to the threshold effect. Operating as narrowband tracking filters, the FMFB and PLL configurations reduce the noise threshold for FM detection. The FMFB demodulator provides a threshold extension of approximately 5 to 7 dB, whereas the PLL demodulator achieves an enhancement of 2 to 3 dB with a relatively simpler circuit.