 Facebook
 Google
 GitHub
 Linkedin
Statistical Significance in Experimentation and Data Analysis
What exactly do scientists and researchers mean when they state that something is or is not statistically significant? How do we establish statistical significance, and how do we interpret it?
Welcome to Part 11 of Robert Keim's series on statistics in electrical engineering. So far, we've addressed both high-level definitions and specific examples of statistical concepts for the hands-on engineer. To catch up on what we've covered, please review the articles listed below:
- How do electrical engineers use statistical analysis?
- How do electrical engineers use descriptive statistics?
- Three descriptive statistical measures in signal processing
- Understanding Bessel’s correction to estimate standard deviation calculations
- What is the normal distribution in electrical engineering?
- Understanding the normal distribution, histograms, and probability
- The value of the Gaussian cumulative distribution function in statistical analysis
- A review of parametric tests, skewness, and kurtosis
- Using correlation, causation, and covariance to understand statistical relationships
- Finding statistical relationships with correlation coefficients
Statistical Significance: A Nebulous Concept?
Anyone who habitually reads research papers will frequently encounter “statistical significance,” often accompanied by a cryptic reference to p < 0.01 or p < 0.05.
Statistical significance is a fundamental tool that helps researchers understand what their experiments and their data have actually revealed, and it helps colleagues to decide if reported results are worthy of further consideration or investigation.
At the same time, statistical significance is a somewhat opaque concept that is easily misinterpreted and that has generated quite a bit of controversy in the scientific community.
In fact, not too long ago three professors published a “Comment” article in the journal Nature that recommended the complete abandonment of statistical significance as a basis for accepting or rejecting a hypothesis—and it took them only one week to find 800 other academics and researchers who were willing to express formal agreement with their position.
What Is Statistical Significance?
An experiment begins with a null hypothesis, which states that there is no relationship between the two phenomena for which data will be collected. If the objective of the experiment is to find or demonstrate some type of relationship or effect, the null hypothesis is tantamount to saying that the experiment will “fail.”
Statistical significance is a mathematical criterion that we can use to decide whether we should accept or reject the null hypothesis.
A result that is statistically significant based on a predetermined probability threshold indicates that we should reject the null hypothesis; in other words, something did happen—a relationship was observed, an effect was produced, an association exists—and therefore the experiment has revealed something that is potentially meaningful or interesting.
Phenomena governed by random processes usually produce a normal distribution of values. Thus, it is common practice to represent a conceptual null hypothesis as a Gaussian curve, meaning that this is the distribution of observations that we expect when one experimental variable is not affected by the other experimental variable.
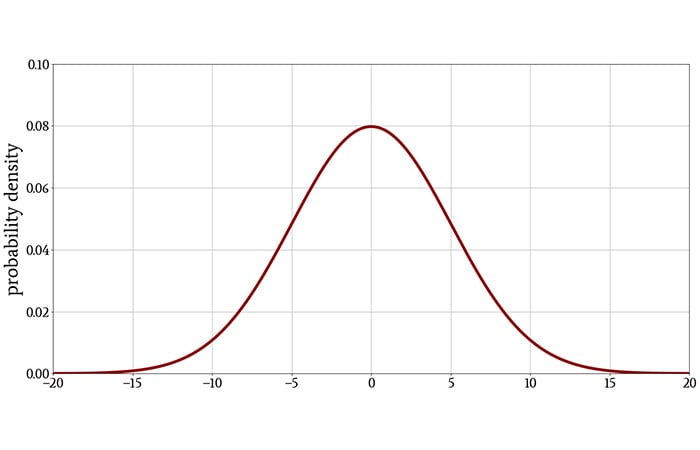
If we assume that the null hypothesis is true, we will often use a Gaussian curve as the probability density function with which we decide whether or not a result is statistically significant.
The Probability Threshold
Statistical significance is based on the probability of obtaining a result under the assumption that the null hypothesis is true. Let’s say that through our experiment we obtained the number x (this could be anything—blood pressure, sales revenue, an average test score).
By referring to the probability density function associated with the null hypothesis, we can determine whether the probability of obtaining x, or some other number that is more unlikely than x, will be less than 5% (p < 0.05), or 1% (p < 0.01), or some other threshold (p < ⍺, where ⍺ denotes the required significance level).
Thus, the p-value conveys the probability of obtaining a result that is equal to or more extreme than the observed result when there is no relationship between the variables of interest.
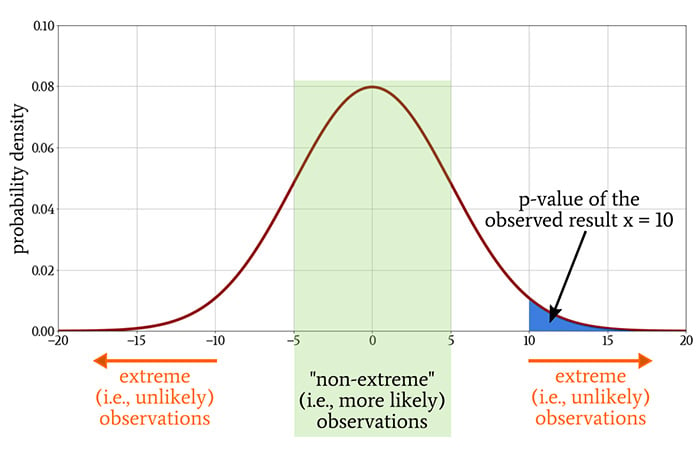
The Gaussian curve is the probability density function that corresponds to the distribution of values when the null hypothesis is true. We calculate the p-value of an observed result by integrating a portion of this probability density function.
If the p-value is sufficiently low, it doesn’t make sense to continue assuming that no relationship exists between the two variables. Thus, we reject the null hypothesis and claim that a relationship exists.
Interpreting Statistical Significance
The preceding explanation describes statistical significance in the way that I find to be most straightforward and mathematically coherent: If the p-value of an observed result is less than the predetermined threshold that we call the significance level, the observed result is very unlikely to occur if the null hypothesis is true. Therefore, we reject the null hypothesis, which is equivalent to affirming that the experiment has found a relationship between the variables of interest.
This same general message can be conveyed in other ways that you may find helpful:
- The p-value is the likelihood that our observations are attributable to mere chance. Thus, if p = 0.05, there is a 5% probability that the result is attributable to chance and a 95% probability that it is attributable to the conditions that we created in our experiment.
- The p-value is the likelihood that we will incorrectly infer a relationship between the variables of interest. A p-value of 0.05, then, indicates that for every 100 experiments in which we inferred a relationship, 95 of these relationships actually existed and 5 did not exist.
Interpreting the Word “Significance”
Much confusion surrounding statistical significance originates in the use of the word “significance,” which in this context is limited to a specific statistical usage and is not the same as the word “significance” in ordinary language.
Statistically significant results are not necessarily important or meaningful results. Statistical significance does not mean practical significance, and likewise, the absence of statistical significance does not mean that experimental results have no practical value.
The Significance Level
To establish statistical significance, we must compare the p-value to the significance level, denoted by ⍺. Significance levels are somewhat arbitrary and are selected according to the conventions of a given field. As indicated above, ⍺ = 0.05 and ⍺ = 0.01 are common, though in some cases a higher value or a much lower value is chosen.
Conclusion
Despite the potential misuse of statistical significance and evidence for widespread misinterpretation, it remains an important technique in research and experimentation. We’ll continue exploring this topic in the next article.


Great! Would be even better if there were some EE-related example showing how it could be applied.