 Facebook
 Google
 GitHub
 Linkedin
How to Use I/Q Signals to Design a Robust FSK Decoder
An improved algorithm, in conjunction with quadrature modulation, can achieve FSK decoding that is not affected by phase misalignment.
An improved algorithm, in conjunction with quadrature modulation, can achieve FSK decoding that is not affected by phase misalignment.
The frequency of an FSK symbol can be identified by examining the DC offsets of the waveforms produced by multiplying the received signal by reference signals. This is a straightforward and effective technique that works flawlessly in an idealized mathematical environment, but we saw in the previous article that it is not robust against phase misalignment.
When a noncoherent receiver architecture is used, there is no way to establish a fixed phase relationship between the transmitter and the receiver. This means that the phase at the beginning of a packet will be unpredictable. This alone would not compromise our decoder algorithm, because we could use the training sequence to identify the phase of the demodulated baseband signal and then modify the reference signals accordingly. (However, I have no experience with this approach, and I don’t know how effective it would be in real life.)
The situation becomes much worse, though, when we consider short-term phase variations, because these can cause the phase of the received signal to deviate from the phase of the reference signal within the space of one packet. Thus, the packet could initially have phase alignment, but the deteriorating phase relationship would produce bit errors that cause the entire packet to be discarded.
Before moving on to the rest of this article, please take a moment to peruse our resources that may help give you more context:
Related Information
- Digital Modulation: Amplitude and Frequency (from Chapter 4 of AAC’s RF textbook)
- Introduction to Software-Defined Radio
- Learning About Differential Quadrature Phase Shift Keying (DQPSK) Modulation
Previous Articles on Scilab-Based Digital Signal Processing
- Introduction to Sinusoidal Signal Processing with Scilab
- How to Perform Frequency-Domain Analysis with Scilab
- How to Use Scilab to Analyze Amplitude-Modulated RF Signals
- How to Use Scilab to Analyze Frequency-Modulated RF Signals
- How to Perform Frequency Modulation with a Digitized Audio Signal
- Digital Signal Processing in Scilab: How to Remove Noise in Recordings with Audio Processing Filters
- Audio Processing in Scilab: How to Implement Spectrum Subtraction
- Digital Signal Processing in Scilab: How to Decode an FSK Signal
- Understanding Phase Misalignment in FSK Decoding
Incorporating Quadrature Demodulation
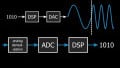
I indicated the solution to this problem at the end of the previous article. We can use quadrature demodulation to produce I and Q baseband signals that allow the FSK decoding algorithm to be insensitive to phase misalignment.
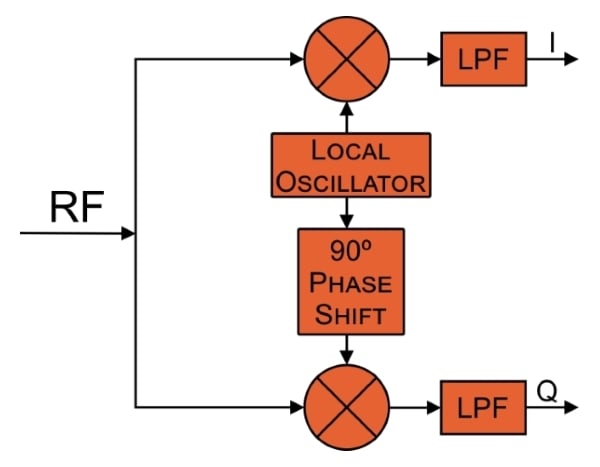
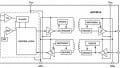
This is a highly beneficial modification to the system, but it means that we need additional components in the demodulation circuit (to generate I/Q signals instead of a single baseband signal) and additional clock cycles in the digital signal processor (because math must be performed on two signals instead of one).
The first concern is fairly minor: quadrature demodulation is extremely common these days, and I think that in most cases it could be adopted without significantly increasing cost, complexity, or PCB size. The severity of the second issue depends on the characteristics of your system. If you have a powerful processor and a low data rate, you might have no problem at all when you incorporate the additional mathematical operations. But if you’ve chosen a low-cost, low-power processor and you’re trying to maximize data rate, all the new computations could make it impossible for the decoding algorithm to finish processing one packet before the next packet arrives.
I/Q FSK Decoding in Scilab
Let’s start by establishing the binary 0 frequency, the binary 1 frequency, and the number of samples per symbol, and then we’ll create the index variable (n) based on the number of samples per symbol.
ZeroFrequency = 10e3;
OneFrequency = 30e3;
SamplingFrequency = 300e3;
Samples_per_Symbol = SamplingFrequency/ZeroFrequency;
n = 0:(Samples_per_Symbol-1);
Generating I/Q Signals
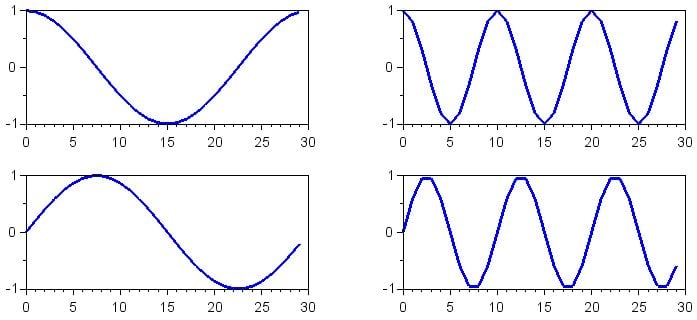
Now we can generate I and Q symbols for the two frequencies. By convention, the I (in-phase) signal is a cosine waveform and the Q (quadrature) signal is a sine waveform.
Symbol_Zero_I = cos(2*%pi*n / (SamplingFrequency/ZeroFrequency));
Symbol_One_I = cos(2*%pi*n / (SamplingFrequency/OneFrequency));
Symbol_Zero_Q = sin(2*%pi*n / (SamplingFrequency/ZeroFrequency));
Symbol_One_Q = sin(2*%pi*n / (SamplingFrequency/OneFrequency));

subplot(2,2,1)
plot(n, Symbol_Zero_I)
subplot(2,2,2)
plot(n, Symbol_One_I)
subplot(2,2,3)
plot(n, Symbol_Zero_Q)
subplot(2,2,4)
plot(n, Symbol_One_Q)

f = gcf();
for k=1:4
  > f.children(k).font_size = 3;
  > f.children(k).children.children.thickness = 3;
  > end
(The for loop at the end changes the size of the tick-mark labels for each subplot and the thickness of each line. You can do the same thing via the graphical interface built into the figure window; using the GUI is more intuitive but becomes tiresome after a while.)
Our goal here is to explore the I/Q solution to phase misalignment, so we’ll need phase-shifted versions of the symbols. As demonstrated in the previous article, the worst-case phase difference between received signal and reference signal is 90°, so we’ll generate symbols with phase of 45° (i.e., halfway between perfect alignment and worst-case alignment) and 90°.
Symbol_Zero_I_45deg = cos(%pi/4 + 2*%pi*n / (SamplingFrequency/ZeroFrequency));
Symbol_One_I_45deg = cos(%pi/4 + 2*%pi*n / (SamplingFrequency/OneFrequency));
Symbol_Zero_Q_45deg = sin(%pi/4 + 2*%pi*n / (SamplingFrequency/ZeroFrequency));
Symbol_One_Q_45deg = sin(%pi/4 + 2*%pi*n / (SamplingFrequency/OneFrequency));
Symbol_Zero_I_90deg = cos(%pi/2 + 2*%pi*n / (SamplingFrequency/ZeroFrequency));
Symbol_One_I_90deg = cos(%pi/2 + 2*%pi*n / (SamplingFrequency/OneFrequency));
Symbol_Zero_Q_90deg = sin(%pi/2 + 2*%pi*n / (SamplingFrequency/ZeroFrequency));
Symbol_One_Q_90deg = sin(%pi/2 + 2*%pi*n / (SamplingFrequency/OneFrequency));
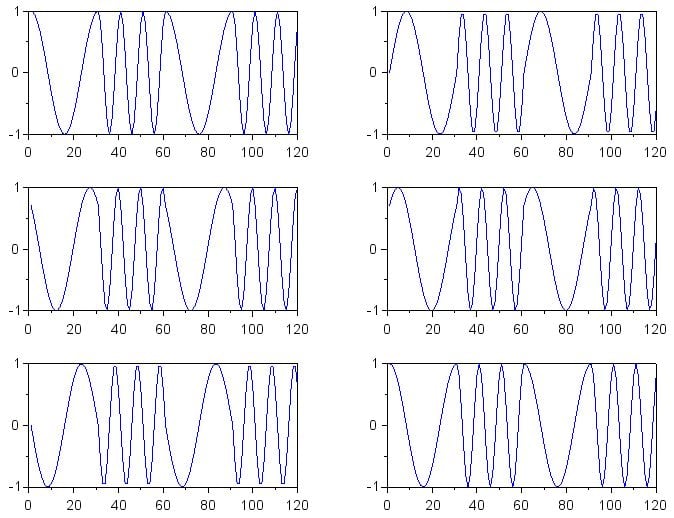
Now let’s create the three sets of I and Q baseband signals for the binary sequence 0101.
Baseband_I_aligned = [Symbol_Zero_I Symbol_One_I Symbol_Zero_I Symbol_One_I];
Baseband_Q_aligned = [Symbol_Zero_Q Symbol_One_Q Symbol_Zero_Q Symbol_One_Q];
Baseband_I_45deg = [Symbol_Zero_I_45deg Symbol_One_I_45deg Symbol_Zero_I_45deg Symbol_One_I_45deg];
Baseband_Q_45deg = [Symbol_Zero_Q_45deg Symbol_One_Q_45deg Symbol_Zero_Q_45deg Symbol_One_Q_45deg];
Baseband_I_90deg = [Symbol_Zero_I_90deg Symbol_One_I_90deg Symbol_Zero_I_90deg Symbol_One_I_90deg];
Baseband_Q_90deg = [Symbol_Zero_Q_90deg Symbol_One_Q_90deg Symbol_Zero_Q_90deg Symbol_One_Q_90deg];

subplot(3,2,1)
plot(Baseband_I_aligned)
subplot(3,2,2)
plot(Baseband_Q_aligned)
subplot(3,2,3)
plot(Baseband_I_45deg)
subplot(3,2,4)
plot(Baseband_Q_45deg)
subplot(3,2,5)
plot(Baseband_I_90deg)
subplot(3,2,6)
plot(Baseband_Q_90deg)

f = gcf();
for k=1:6
  > f.children(k).font_size = 3;
  > end
I/Q Multiplication
We can now multiply our phase-aligned and phase-shifted I/Q baseband signals by the reference symbols. Try not to be distracted by the long list of computations; all we’re doing is multiplying the I and Q waveforms first by an equal-length array of binary 0 symbols and then by an equal-length array of binary 1 symbols. We have to do this three times, though, because we want to compare the results for the phase-aligned version, the phase = 45° version, and the phase = 90° version. This doesn’t reflect the implementation that would be performed by a digital signal processor—in a real application there would be only one I/Q baseband signal.
Note that here I’m using the I symbols as the reference symbols, but I could also use the Q symbols. And actually, I could use a reference symbol with any phase value: by incorporating I/Q techniques into this decoding algorithm, we’re making the procedure insensitive to any type of phase discrepancy between the received symbol and the reference symbol.
DecodeZero_I_aligned = Baseband_I_aligned .* [Symbol_Zero_I Symbol_Zero_I Symbol_Zero_I Symbol_Zero_I];
DecodeZero_Q_aligned = Baseband_Q_aligned .* [Symbol_Zero_I Symbol_Zero_I Symbol_Zero_I Symbol_Zero_I];
DecodeOne_I_aligned = Baseband_I_aligned .* [Symbol_One_I Symbol_One_I Symbol_One_I Symbol_One_I];
DecodeOne_Q_aligned = Baseband_Q_aligned .* [Symbol_One_I Symbol_One_I Symbol_One_I Symbol_One_I];

DecodeZero_I_45deg = Baseband_I_45deg .* [Symbol_Zero_I Symbol_Zero_I Symbol_Zero_I Symbol_Zero_I];
DecodeZero_Q_45deg = Baseband_Q_45deg .* [Symbol_Zero_I Symbol_Zero_I Symbol_Zero_I Symbol_Zero_I];
DecodeOne_I_45deg = Baseband_I_45deg .* [Symbol_One_I Symbol_One_I Symbol_One_I Symbol_One_I];
DecodeOne_Q_45deg = Baseband_Q_45deg .* [Symbol_One_I Symbol_One_I Symbol_One_I Symbol_One_I];

DecodeZero_I_90deg = Baseband_I_90deg .* [Symbol_Zero_I Symbol_Zero_I Symbol_Zero_I Symbol_Zero_I];
DecodeZero_Q_90deg = Baseband_Q_90deg .* [Symbol_Zero_I Symbol_Zero_I Symbol_Zero_I Symbol_Zero_I];
DecodeOne_I_90deg = Baseband_I_90deg .* [Symbol_One_I Symbol_One_I Symbol_One_I Symbol_One_I];
DecodeOne_Q_90deg = Baseband_Q_90deg .* [Symbol_One_I Symbol_One_I Symbol_One_I Symbol_One_I];
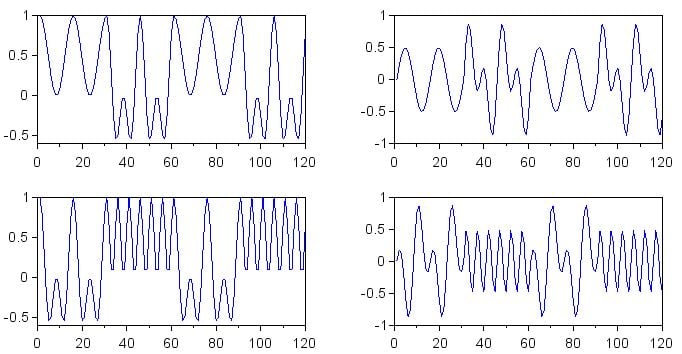
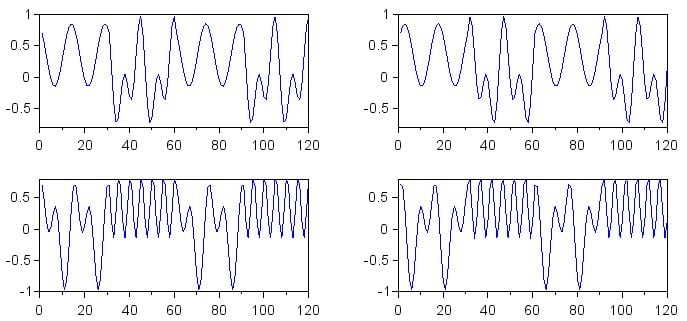
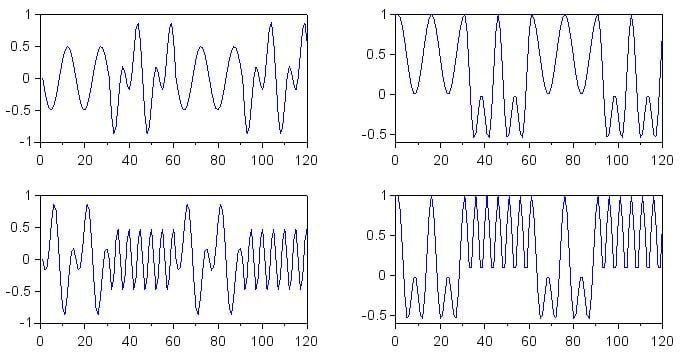
The following plots show the waveforms produced by the multiplication.
subplot(2,2,1)
plot(DecodeZero_I_aligned)
subplot(2,2,2)
plot(DecodeZero_Q_aligned)
subplot(2,2,3)
plot(DecodeOne_I_aligned)
subplot(2,2,4)
plot(DecodeOne_Q_aligned)
subplot(2,2,1)
plot(DecodeZero_I_45deg)
subplot(2,2,2)
plot(DecodeZero_Q_45deg)
subplot(2,2,3)
plot(DecodeOne_I_45deg)
subplot(2,2,4)
plot(DecodeOne_Q_45deg)
subplot(2,2,1)
plot(DecodeZero_I_90deg)
subplot(2,2,2)
plot(DecodeZero_Q_90deg)
subplot(2,2,3)
plot(DecodeOne_I_90deg)
subplot(2,2,4)
plot(DecodeOne_Q_90deg)
Conclusion
If you ponder the last set of plots, I think that you will start to understand the benefit of I/Q processing in the context of FSK decoding. As the phase of the incoming signal loses alignment with the phase of the reference symbol, the DC offset of the multiplication waveform becomes unreliable as an indicator of similarity between the received frequency and the reference frequency. However, the presence of the 90°-phase-shifted baseband signal compensates for this effect, because as the phase difference of one baseband signal approaches ±90° (the worst-case scenario), the phase of the other baseband signal approaches 0° or 180° (the best-case scenario).
In the next article, we will continue this discussion by exploring some additional details regarding how to interpret and process the results of I/Q multiplication.


at first sight, it is the very composite subject. I am not an expert in it, on it I understood nothing. I got used to making everything easier, such as here https://papersgram.com/thesis-writing-service/