Facebook
 Google
 GitHub
 Linkedin
AC Electric Circuits
AC phase
24 questions By Tony R. Kuphaldt
-
Question 10 of 24
These two phasors are written in a form known as polar notation. Re-write them in rectangular notation:
4 ∠ 0o = 3 ∠ 90o = Reveal answerThese two phasors, written in rectangular notation, would be 4 j0 and 0 j3, respectively, although a mathematician would probably write them as 4 i0 and 0 i3, respectively.
Challenge question: what does the lower-case j or i represent, in mathematical terms?
Notes:Discuss with your students the two notations commonly used with phasors: polar and rectangular form. They are merely two different ways of “saying” the same thing. A helpful “prop” for this discussion is the complex number plane (as opposed to a number line - a one-dimensional field), showing the “real” and “imaginary” axes, in addition to standard angles (right = 0o, left = 180o, up = 90o, down = 270o). Your students should be familiar with this from their research, so have one of them draw the number plane on the whiteboard for all to view.
The challenge question regards the origin of complex numbers, beginning with the distinction of “imaginary” numbers as being a separate set of quantities from “real” numbers. Electrical engineers, of course, avoid using the lower-case letter i to denote “imaginary” because it would be so easily be confused with the standard notation for instantaneous current i.
-
Question 11 of 24
In this graph of two AC voltages, which one is leading and which one is lagging?
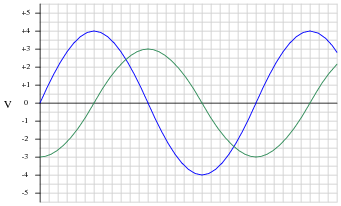
If the 4-volt (peak) sine wave is denoted in phasor notation as 4 V ∠ 0o, how should the 3-volt (peak) waveform be denoted? Express your answer in both polar and rectangular forms.
If the 4-volt (peak) sine wave is denoted in phasor notation as 4 V ∠ 90o, how should the 3-volt (peak) waveform be denoted? Express your answer in both polar and rectangular forms.
Reveal answerThe 4-volt (peak) waveform leads the 3-volt (peak) waveform. Conversely, the 3-volt waveform lags behind the 4-volt waveform.
If the 4-volt waveform is denoted as 4 V ∠ 0o, then the 3-volt waveform should be denoted as 3 V ∠ -90o, or 0 − j3 V.
If the 4-volt waveform is denoted as 4 V ∠ 90o (0 j4 V in rectangular form), then the 3-volt waveform should be denoted as 3 V ∠ 0o, or 3 j0 V.
Notes:In my years of teaching, I have been surprised at how many students struggle with identifying the “leading” and “lagging” waveforms on a time-domain graph. Be sure to discuss this topic well with your students, identifying methods for correctly distinguishing “leading” waves from “lagging” waves.
This question also provides students with good practice expressing leading and lagging waves in phasor notation. One of the characteristics of phasors made evident in the answer is the relative nature of angles. Be sure to point this out to your students.
-
Question 12 of 24
A common feature of oscilloscopes is the X−Y mode, where the vertical and horizontal plot directions are driven by external signals, rather than only the vertical direction being driven by a measured signal and the horizontal being driven by the oscilloscope’s internal sweep circuitry:
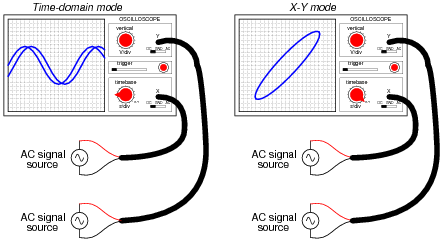
The oval pattern shown in the right-hand oscilloscope display of the above illustration is typical for two sinusoidal waveforms of the same frequency, but slightly out of phase with one another. The technical name for this type of X−Y plot is a Lissajous figure.
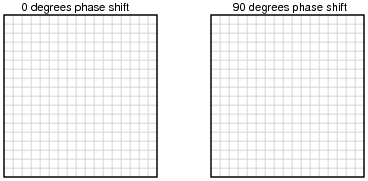
What should the Lissajous figure look like for two sinusoidal waveforms that are at exactly the same frequency, and exactly the same phase (0 degrees phase shift between the two)? What should the Lissajous figure look like for two sinusoidal waveforms that are exactly 90 degrees out of phase?
A good way to answer each of these questions is to plot the specified waveforms over time on graph paper, then determine their instantaneous amplitudes at equal time intervals, and then determine where that would place the “dot” on the oscilloscope screen at those points in time, in X−Y mode. To help you, I’ll provide two blank oscilloscope displays for you to draw the Lissajous figures on:
Reveal answer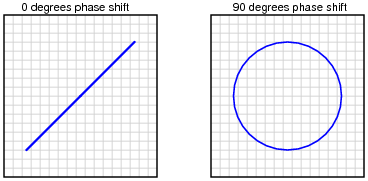
Challenge question: what kind of Lissajous figures would be plotted by the oscilloscope if the signals were non-sinusoidal? Perhaps the simplest example of this would be two square waves instead of two sine waves.
Notes:Many students seem to have trouble grasping how Lissajous figures are formed. One of the demonstrations I use to overcome this conceptual barrier is an analog oscilloscope and two signal generators set to very low frequencies, so students can see the “dot” being swept across the screen by both waveforms in slow-motion. Then, I speed up the signals and let them see how the Lissajous pattern becomes more “solid” with persistence of vision and the inherent phosphor delay of the screen.