Facebook
 Google
 GitHub
 Linkedin
Discrete Semiconductor Devices and Circuits
Bipolar Junction Transistors in Active Mode
23 questions By Tony R. Kuphaldt
-
Question 16 of 23
Though the characteristic curves for a transistor are usually generated in a circuit where base current is constant and the collector-emitter voltage (VCE) is varied, this is usually not how transistor amplifier circuits are constructed. Typically, the base current varies with the input signal, and the collector power supply is a fixed-voltage source:

The presence of a load resistor in the circuit adds another dynamic to the circuit’s behavior. Explain what happens to the transistor’s collector-emitter voltage (VCE) as the collector current increases (dropping more battery voltage across the load resistor), and qualitatively plot this load line on the same type of graph used for plotting transistor curves:

Reveal answerBecause there are no numbers along the axes of this graph, the best you can do is plot the general slope of the line, from upper-left to lower-right:

Notes:Ask your student why this plot is straight, and not curved like the transistor’s characteristic function.
-
Question 17 of 23
Calculate and superimpose the load line for this circuit on top of the transistor’s characteristic curves:
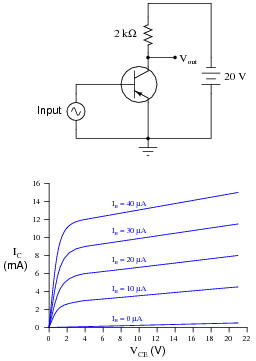
Then, determine the amount of collector current in the circuit at the following base current values:
- IB = 10 μA
- IB = 20 μA
- IB = 30 μA
- IB = 40 μA
Reveal answer
- IB = 10 μA ; IC = 3.75 mA
- IB = 20 μA ; IC = 6.25 mA
- IB = 30 μA ; IC = 8.5 mA
- IB = 40 μA ; IC = 9.5 mA
Notes:It would be good to point out something here: superimposing a linear function on a set of nonlinear functions and looking for the intersection points allows us to solve for multiple variables in a nonlinear mathematical system. Normally, only linear systems of equations are considered “solvable” without resorting to very time-consuming arithmetic computations, but here we have a powerful (graphical) tool for approximating the values of variables in a nonlinear system. Since approximations are the best we can hope for in transistor circuits anyway, this is good enough!
-
Question 18 of 23
In this graph you will see three different load lines plotted, representing three different values of load resistance in the amplifier circuit:
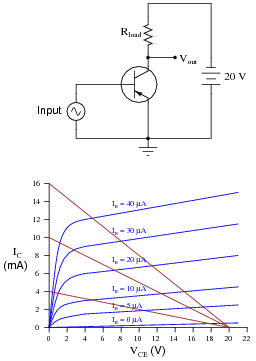
Which one of the three load lines represents the largest value of load resistance (Rload)? Which of the three load lines will result in the greatest amount of change in voltage drop across the transistor (∆VCE) for any given amount of base current change (∆IB)? What do these relationships indicate about the load resistor’s effect on the amplifier circuit’s voltage gain?
Reveal answerThe load line closest to horizontal represents the largest value of load resistance, and it also represents the condition in which VCE will vary the most for any given amount of base current (input signal) change.
Notes:This question challenges students to relate load resistor values to load lines, and both to the practical measure of voltage gain in a simple amplifier circuit. As an illustration, ask the students to analyze changes in the circuit for an input signal that varies between 5 μA and 10 μA for the three different load resistor values. The difference in ∆VCE should be very evident!