Facebook
 Google
 GitHub
 Linkedin
DC Lab - Capacitor Charging and Discharging
Project Overview
This circuit project will demonstrate to you how the voltage changes exponentially across capacitors in series and parallel RC (resistor-capacitor) networks. You will also examine how you can increase or decrease the rate of change of the capacitor charging and discharging.
Parts and Materials
To do this experiment, you will need the following:
- 6 V battery or power supply
- Two large electrolytic capacitors, 1000 µF minimum
- Two 1 kΩ resistors
- One toggle switch, SPST (Single-Pole, Single-Throw)—I recommend a household light switch
Large-value capacitors are required for this experiment to produce time constants slow enough to track with a voltmeter and stopwatch.
CAUTION: Be warned that most large capacitors are of the electrolytic type, and they are polarity sensitive! One terminal of each capacitor should be marked with a definite polarity sign (+ or —). Usually, capacitors of the size specified have a negative (-) marking or series of negative markings pointing toward the negative terminal. Very large capacitors are often polarity-labeled by a positive (+) marking next to one terminal.
Failure to heed proper polarity will almost surely result in capacitor failure, even with a source voltage as low as 6 V. When electrolytic capacitors fail, they typically explode, spewing caustic chemicals and emitting foul odors. Please, try to avoid this!
Learning Objectives
- Capacitor charging
- Capacitor discharging
- RC time constant calculation
- Series and parallel capacitance
Instructions
Step 1: Build the charging circuit, illustrated in Figure 2 and represented by the top circuit schematic in Figure 3.
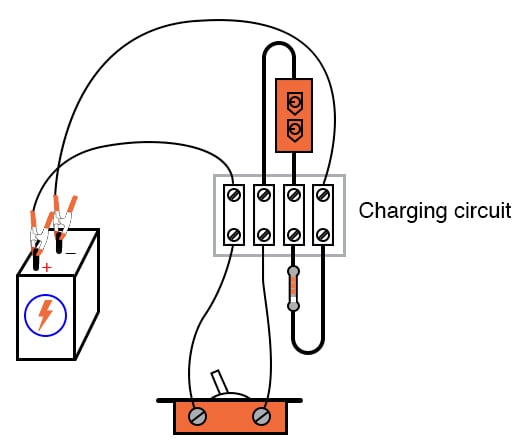
Figure 2. Charging circuit with a series connection of a switch, capacitor, and resistor.
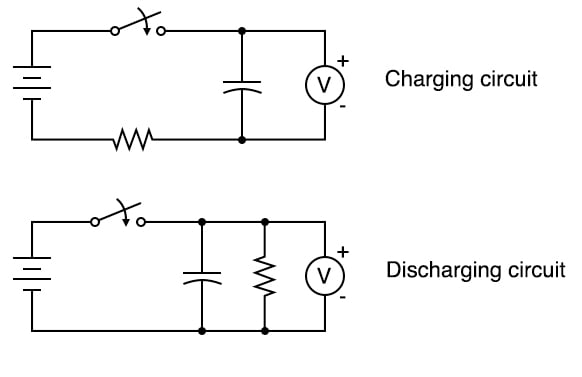
Figure 3. Circuit schematic diagrams for capacitive charging and discharging circuits.
Step 2: Measure the voltage across the capacitor over time after the switch is closed. Notice how it increases slowly over time rather than suddenly, as would be the case with a resistor. You can reset the capacitor back to a voltage of zero by shorting across its terminals with a piece of wire.
The time constant (τ) of a resistor-capacitor circuit is calculated by taking the circuit resistance, R, and multiplying it by the circuit capacitance, C. For a 1 kΩ resistor and a 1000 µF capacitor, the time constant is 1 second.
$$\tau = RC = 1000 \times 0.001 = 1 \text{ s}$$
This is the amount of time it takes for the capacitor voltage to increase by approximately 63.2% from its present value to its final value: the battery's voltage. The 63.2% value is calculated from the following equation describing the voltage across the capacitor as it charges over time:
$$V_C = V_S · (1 - e^{(\frac{-t}{\tau})})$$
Where:
- VC is the voltage across the capacitor in V
- VS is the voltage of the source in V
- t is the time since the closing of the switch in s
- \(\tau\) is the RC time constant in s
Next, it is educational to plot the voltage of a charging capacitor over time to see how the inverse exponential curve develops. If you plot the capacitor voltage versus time, it will look as shown in Figure 4.
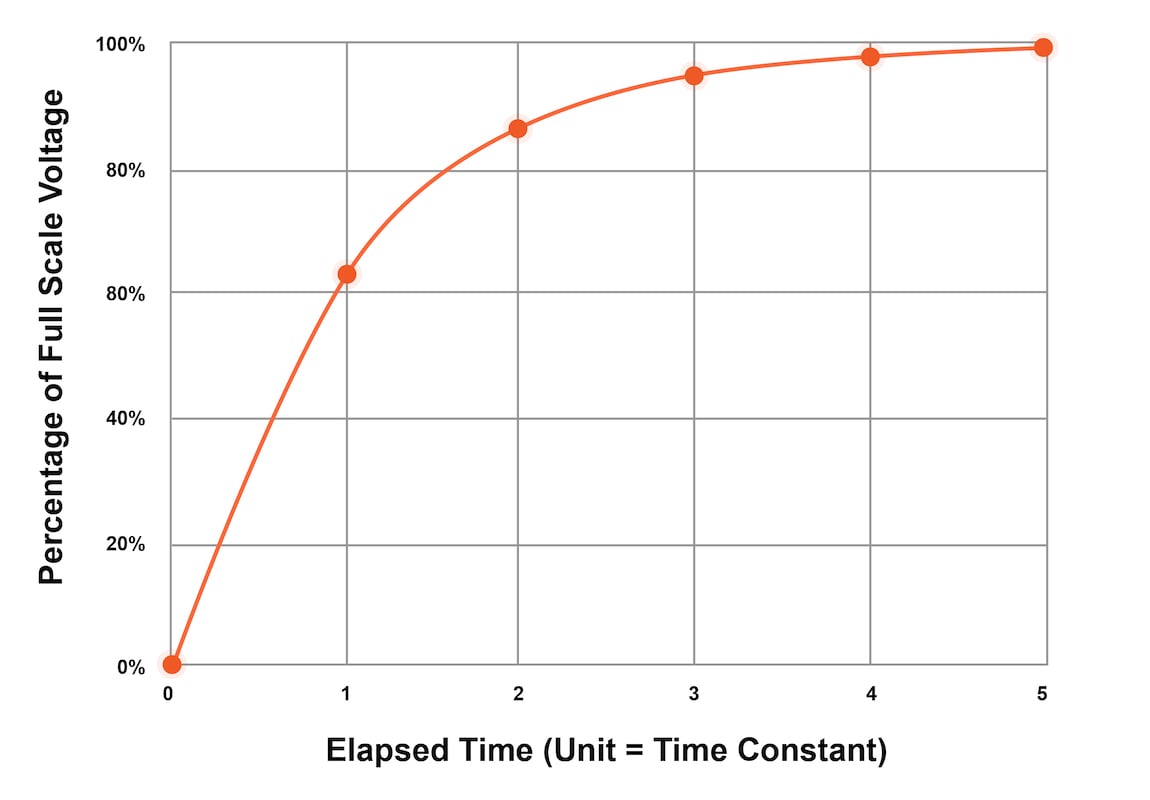
Figure 4. A plot of the capacitor voltage over time for the charging circuit.
Keep in mind that, in order to plot the action of this circuit, we must find a way of slowing it down. A one-second time constant doesn’t provide much time to take voltmeter readings!
Changing a Circuit’s Time Constant
We can increase this circuit’s time constant in two different ways:
- Changing the total circuit resistance
- Changing the total circuit capacitance
Step 3: Try to increase the time constant of the RC circuit by adding an additional resistor into the charging circuit. You should already know by now how multiple resistors need to be connected to form a greater total resistance.
Step 4: Try to change the RC time constant by adding an additional capacitor to the charging circuit. Experiment by adding the second capacitor in both series and parallel with the original capacitor. Which connection method increased the time constant, and which caused it to decrease? Just be sure to insert the capacitor(s) in the proper direction with the ends labeled negative (-) electrically closest to the battery’s negative terminal.
Step 5: Given a pair of identical resistors and a pair of identical capacitors, experiment with various series and parallel combinations to obtain the slowest charging action.
Building a Capacitive Discharging Circuit
Step 6: The discharging circuit of Figure 5 and the bottom of Figure 3 provides the same kind of changing capacitor voltage, except this time, the voltage jumps to full battery voltage when the switch closes and slowly falls when the switch is opened.
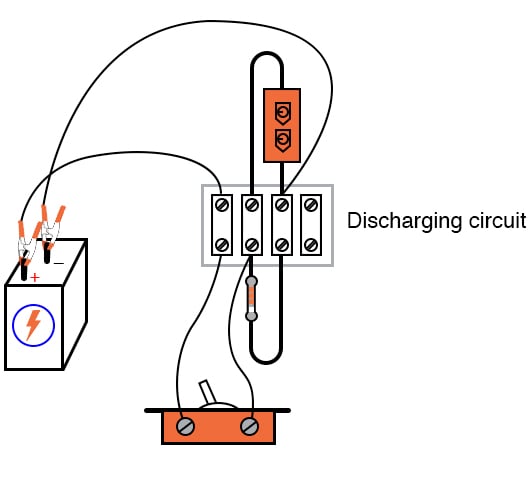
Figure 5. Discharging circuit with a parallel connection of a capacitor and resistor
Build this circuit and monitor the voltage change before and after closing the switch.
Step 6: Experiment once again with different combinations of resistors and capacitors to change the RC time constant of the discharging circuit. Always make sure that the capacitor’s polarity is correct!
Computer SPICE Simulation of the Series RC Charging Circuit
Step 7: You can also simulate the circuit of Figure 6 in SPICE and plot the exponential charging of the capacitor voltage. You can then compare this result with your measured values from earlier in this project.
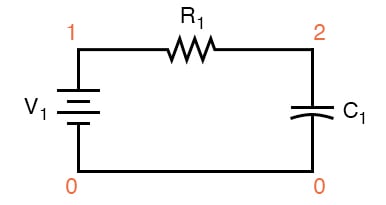
Figure 6. RC circuit schematic with SPICE node numbers
Below is the netlist (make a text file containing the following text, verbatim):
Capacitor charging circuit
v1 1 0 dc 6
r1 1 2 1k
c1 2 0 1000u ic=0
.tran 0.1 5 uic
.plot tran v(2,0)
.end
Related Content
Learn more about the fundamentals behind this project in the resources below.
Calculators:
Textbook:
Worksheets: