
 Facebook
 Google
 GitHub
 Linkedin
AC Electric Circuits
Basic Oscilloscope Operation
25 questions By Tony R. Kuphaldt
-
Question 19 of 25
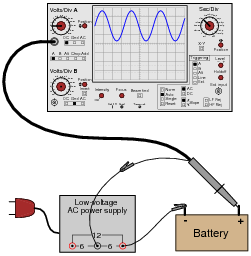
If an oscilloscope is connected to a series combination of AC and DC voltage sources, what is displayed on the oscilloscope screen depends on where the “coupling” control is set.
With the coupling control set to “DC”, the waveform displayed will be elevated above (or depressed below) the “zero” line:
Setting the coupling control to ÄC”, however, results in the waveform automatically centering itself on the screen, about the zero line.
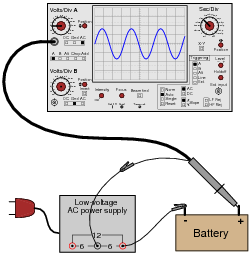
Based on these observations, explain what the “DC” and ÄC” settings on the coupling control actually mean.
Reveal answerThe “DC” setting allows the oscilloscope to display all components of the signal voltage, both AC and DC, while the ÄC” setting blocks all DC within the signal, to only display the varying (AC) portion of the signal on the screen.
Notes:A common misconception among students is that the “DC” setting is used for measuring DC signals only, and that the ÄC” setting is used for measuring AC signals only. I often refer to the “DC” setting as direct coupling in order to avoid the connotation of “direct current,” in an attempt to reinforce the idea that with “DC” coupling, what you see is all that’s really there. With ÄC” coupling, only part of the signal is being coupled to the input amplifier circuitry.
-
Question 20 of 25
Explain what happens inside an oscilloscope when the “coupling” switch is moved from the “DC” position to the ÄC” position.
Reveal answer
Notes:In order for students to answer this question, they must review the internal operation of an oscilloscope. This does not have to be rigorous - a block-diagram understanding is good enough. The important thing is that they understand what the capacitor does for the oscilloscope input. Once this is understood, students will have a much better understanding of why and where the coupling control is used.
-
Question 21 of 25
Suppose a technician measures the voltage output by an AC-DC power supply circuit:
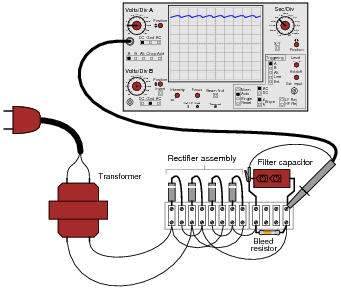
The waveform shown by the oscilloscope is mostly DC, with just a little bit of AC “ripple” voltage appearing as a ripple pattern on what would otherwise be a straight, horizontal line. This is quite normal for the output of an AC-DC power supply.
Suppose we wished to take a closer view of this “ripple” voltage. We want to make the ripples more pronounced on the screen, so that we may better discern their shape. Unfortunately, though, when we decrease the number of volts per division on the “vertical” control knob to magnify the vertical amplification of the oscilloscope, the pattern completely disappears from the screen!
Explain what the problem is, and how we might correct it so as to be able to magnify the ripple voltage waveform without having it disappear off the oscilloscope screen.
Reveal answerThe problem is that the vertical axis input is DC-coupled.
Follow-up question: predict the frequency of the ripple voltage in this power supply circuit.
Notes:As usual, what I’m looking for in an answer here is an explanation for what is happening. If a student simply tells you, “the vertical input is DC-coupled,” press them for more detail. What does it mean for the input to be “DC-coupled,” and why does this cause the line to disappear from the screen when we increase the vertical sensitivity? What alternative do we have to “DC coupling” on an oscilloscope?
One nice thing about oscilloscopes is that they cannot be damaged by “pegging” the display, as can analog multimeters. The same concept applies, though, and is useful in explaining to students why waveforms disappear from the screen when the vertical sensitivity is too great.







this is so helpful thank you
Veľká vďaka za poučný článok. Ešte keby tam bolo napísané, ako sa vypočítala tá frekvencia 400 Hz, 40 Hz, 6,67 kHz